

by Kelley Rendziperis, on Apr 18, 2018 8:00:00 AM
To help understand economic incentive trends, this report evaluates economic incentive deals announced during the first quarter of 2018.
More than $1.4 billion in economic incentives
At publication time, Site Selection Group identified 369 economic incentive packages offered to companies across the United States during the first quarter of 2018. These economic incentive packages represent an estimated total incentive value of more than $1.4 billion. To garner these economic incentives, companies are expected to spend more than $8.8 billion of capital and generate almost 40,000 new jobs, resulting in:
- A total return on investment of approximately 16.8%
- An average economic incentive award of $37,792 per new job
- An average incentive award of approximately $4 million per project
- A median economic incentive award of approximately $470,000
The value of announced economic incentive packages increased 19% from $1.25 billion to $1.4 billion in comparison to the first quarter of 2017, while total capital investment decreased 41.7% from $15.24 billion to $8.8 billion. The year-over-year Q1 comparison also reflects an increase in the average award per job from $30,175 to $37,792, but a decrease in the number of announced projects of 14% from 430 to 369.
The largest economic incentive package of $700 million was offered to Toyota-Mazda for a joint venture to invest $1.6 billion to build a new assembly plant in Huntsville, Alabama. The company will create 4,000 new jobs paying an average annual wage of $50,000.
The 369 announced economic incentive packages represent 35 states, led by Pennsylvania with 68 deals and Kentucky with 61. The states which announced projects with the largest value of economic incentives offered include Alabama with $711 million (primarily Toyota-Mazda), Pennsylvania with $95 million, New Jersey with $86 million, and Florida with $70 million.
The following chart depicts the 369 projects by estimated incentive value:
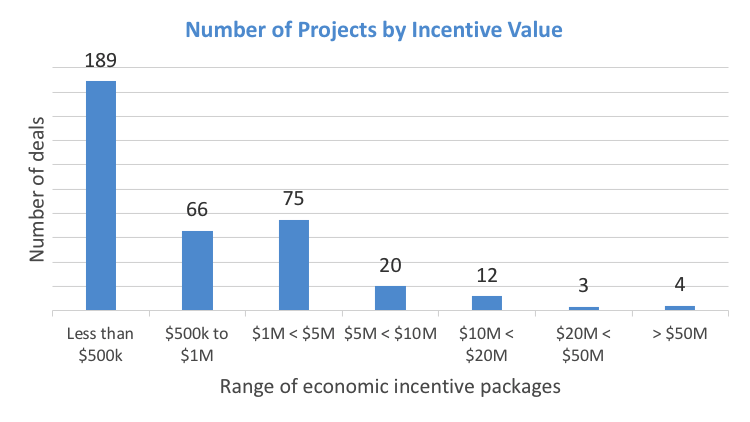
Data Source: IncentivesMonitor, a service from WAVTEQ Limited.
Approximately 69.1%, or 255 of 369 announced projects, were awarded economic incentive packages valued at $1 million or less and 89.5% were awarded economic incentive packages valued at $5 million or less. While the average economic incentive package was valued at approximately $4 million for all 369 announced projects, the average economic incentive package for the top 25 deals was approximately $47 million.
The top 25 economic incentive packages announced in Q1 represent approximately $1.17 billion of the total $1.4 billion of estimated incentives, over 78%. These projects in isolation will account for:
- $4.6 billion of capital investment
- Over 14,885 new jobs
- A return on investment of approximately 25.5
- $78,910 per new job.
20 of the largest economic incentive packages in the first quarter
The following table identifies some of the largest economic incentive deals offered, in various industry functions, in the first quarter of 2018. These projects provide a great way to benchmark the range of economic incentives that exists for a variety of project types. However, it is important to understand the values are estimated and typically only reflective of state level incentives.
| Company | Location | Industry Function | Incentives Value ($M) | Capex ($M) | Jobs Created |
|---|---|---|---|---|---|
| Toyota-Mazda | AL | Manufacturing | 700.00 | 1,600 | 4,000 |
| General Dynamics | ME | Construction & Infrastructure | 60.00 | 200 | 0 |
| Jinko Solar | FL | Headquarters | 54.00 | 410 | 800 |
| Benjamin Foods | NJ | Distribution Center | 52.47 | 74 | 251 |
| Nikola Motor Co. | AZ | Headquarters | 46.50 | 1,000 | 2,000 |
| ASML Holding | CT | Manufacturing | 20.00 | 100 | 524 |
| Berkshire Hathaway | IN | Business Services | 16.50 | 16 | 1,474 |
| Lamb Weston Holdings | OR | Manufacturing | 15.00 | 220 | 140 |
| Weatherby | WY | Headquarters | 14.88 | 4 | 90 |
| Accelo | CO | Headquarters | 14.80 | 0 | 787 |
| Maxar Technologies | CO | Headquarters | 14.30 | 0 | 856 |
| Infosys | CT | Business Services | 14.00 | 21 | 1,000 |
| Post Holdings | IA | Manufacturing | 13.67 | 85 | 168 |
| Nucor | FL | Manufacturing | 13.00 | 227 | 250 |
| Chickasaw Nation Industries | NC | Headquarters | 12.00 | 29 | 367 |
| Aditya Birla Management | KY | Manufacturing | 11.50 | 305 | 125 |
| Aero Spec NDT Services | NV | Headquarters | 9.95 | 125 | 30 |
| Rightway Fasteners | IN | Manufacturing | 9.85 | 0 | 17 |
| Archer Daniels Midland Co. | IA | Manufacturing | 8.26 | 196 | 0 |
| NB Ventures (GEP) | NJ | Business Services | 7.45 | 2 | 147 |
Data Source: IncentivesMonitor, a service from WAVTEQ Limited.
In addition, some notable first-quarter projects garnering economic incentives in the business services and call center industry functions are as follows:
| Company | Location | Industry Function | Incentives Value ($M) | Capex ($M) | Jobs Created |
|---|---|---|---|---|---|
| Cenlar Capital Corp | MO | Business Services | 700.00 | 1,600 | 4,000 |
| Conduent | NY | Call Center | 5.00 | 7.00 | 315 |
| Francisco Partners | NY | Business Services | 3.43 | 1.46 | 71 |
| Campbell Clinic | TN | Business Services | 3.00 | 30.00 | 185 |
| C4 Mining Co. | NV | Business Services | 1.99 | 30.43 | 13 |
| Medicine Industry | IA | Call Center | 1.60 | 19.60 | 105 |
| CVS Health | OH | Business Services | 1.43 | 0.00 | 350 |
| NiSource | PA | Call Center | 1.37 | 0.00 | 35 |
Data Source: IncentivesMonitor, a service from WAVTEQ Limited.
Economic incentives and industry trends
The following chart depicts the breakdown of the 369 announced projects during Q1 2018 by industry sector:
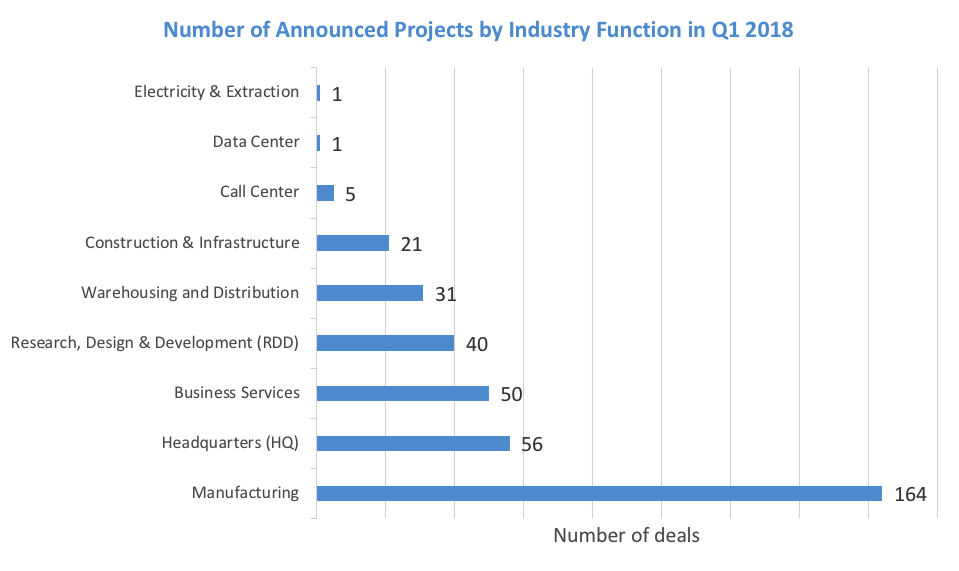
Data Source: IncentivesMonitor, a service from WAVTEQ Limited.
Please note that the analysis above is based on publicly available data at the time of this article. In addition, the current quarter’s data is compared to the information available at the time of prior quarterly articles.
For additional information about these projects and others, please contact me at krendziperis@siteselectiongroup.com.
Source: IncentivesMonitor, a service from WAVTEQ Limited. www.incentivesmonitor.com
