Largest Economic Incentive Deals of Second Quarter 2020
by Kelley Rendziperis, on Jul 22, 2020 11:04:00 AM
To help understand economic incentive trends, this report evaluates economic incentive deals announced during the second quarter of 2020.
$498 million in economic incentives
As of the date of publication, Site Selection Group identified 305 economic incentive packages offered to companies across the United States during the second quarter of 2020. These economic incentive packages represent an estimated total incentive value of approximately $498 million. To garner these economic incentives, companies are expected to spend roughly $7.3 billion of capital investment and generate over 27,400 new jobs, resulting in:
- A total return on investment of approximately 6.9%;
- An average economic incentive award of $18,201 per new job;
- An average incentive award of approximately $1.6 million per project; and
- A median economic incentive award of approximately $210,000.
When compared to the second quarter of 2019, Q2 2020 had a significant drop in the number of projects by roughly 50%, from 610 to 305 projects. The largest declines between these two periods were the total value of capital investment (-60.8%), number of jobs (-59.5%) and the total incentives value (-60.3%).
The largest announced economic incentive package this quarter was offered to Linear Labs by the State of Texas to build an advanced, smart manufacturing plant in Fort Worth. The company accepted a performance-based grant of $68.9 million from the city of Fort Worth over a 15-year period. The company plans to invest $618 million to build a 500,000-square-foot facility and create 1,200 new jobs.
The 305 announced projects during the second quarter represented 28 states, led by Michigan with 47 announced projects and Kentucky with 36. North Carolina and California offered the largest value of announced economic incentives with $111.7 million and $105.5 million, respectively. The incentives offered by North Carolina included Bandwidth Inc. — a project that is set to create more than 1,100 jobs with $103 million in capital investment at its Raleigh headquarters — and 26 other projects.
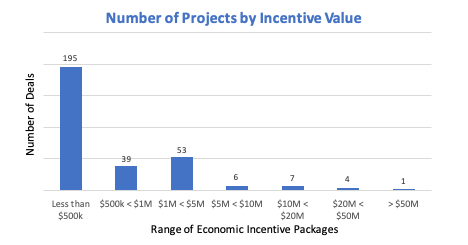
The following chart depicts the number of projects announced during the second quarter broken out by estimated economic incentive value:
 Data Source: IncentivesFlow, a service from WAVTEQ Limited
Approximately 76.7%, or 234 of the 305 announced projects, were awarded economic incentive packages valued at $1 million or less and 94.1% were awarded economic incentive packages valued at $5 million or less. While the average economic incentive package was valued at approximately $1.6 million for all 305 announced projects, the average package for the top 25 deals was approximately $145 million.
Economic incentives and industry trends
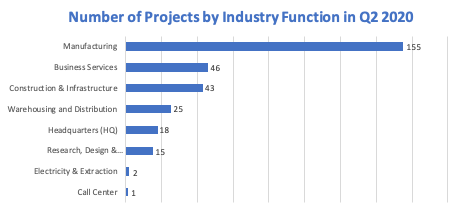
The following chart depicts the breakdown of the 305 announced projects during the second quarter of 2020 by industry function:

Data Source: IncentivesFlow, a service from WAVTEQ Limited
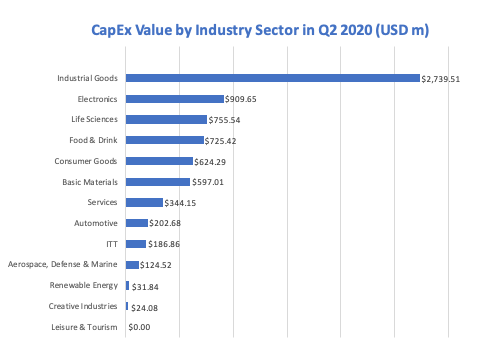
Manufacturing continues to be the top incentivized industry function this quarter. The top industry sectors for total estimated capital investment were the Industrial Goods and Electronics sectors, which together account for nearly 50.2% of all the investment announced during this period. The Industrial Goods sector was led by DesertXpress, a manufacturer and operator of passenger train systems, which will invest $2.18 billion to establish a new facility and purchase manufacturing equipment in Victorville, California.
The chart below illustrates the level of capital investment committed by industry sector this quarter:
 Data Source: IncentivesFlow, a service from WAVTEQ Limited
20 of the largest economic incentive packages in the second quarter
The top 25 economic incentive packages announced in the second quarter represent approximately $363 million of the total $498 million of estimated incentives for all projects, or approximately 72.9%. These projects in isolation will account for:
- $4.7 billion of capital investment
- 11,456 new jobs
- A return on investment of approximately 7.6%
- $31,716 average award per new job
The following table identifies some of the largest economic incentive deals (removing real estate development and film incentives) offered in Q2 2020. These projects provide a great way to benchmark the potential range of economic incentives for a variety of project types. However, it is important to understand these values are estimated and typically only reflect state level incentives.
| Company | Destination State | Industry function | Incentives Value (USD m) | Capex (USD m) | New Jobs |
|---|---|---|---|---|---|
| Linear Labs | TX | Manufacturing | $68.90 | 618 | 1,200 |
| Papé Group | CA | Manufacturing | $44.50 | 44.5 | 99 |
| Bandwidth | NC | Headquarters | $43.03 | 103 | 1,165 |
| Ontex Group | NC | Manufacturing | $30.30 | 93.0 | 403 |
| Accenture | MO | RDD | $20.00 | 0.0 | 1,400 |
| Charlotte Pipe & Foundry | NC | Manufacturing | $15.50 | 325.0 | 400 |
| Northrop Grumman | CA | Manufacturing | $15.00 | 57.0 | 337 |
| Malouf | UT | Headquarters | $14.39 | 120.0 | 1,195 |
| GoHealth | UT | Business Services | $13.05 | 10.0 | 1,159 |
| Cargill | IA | Manufacturing | $11.5 | 210.0 | 14 |
| Contemp. Amperex Tech. | KY | Manufacturing | $10.0 | 97.7 | 350 |
| DesertXpress Enterprises | CA | Manufacturing | $10.00 | 2,175.0 | 320 |
| INFOCU5 | CO | Business Services | $8.37 | 0.0 | 403 |
| Exelixis | CA | RDD | $7.00 | 90.9 | 500 |
| GRAIL | NC | RDD | $6.92 | 100.0 | 398 |
| Grifols | NC | RDD | $6.88 | 351.6 | 300 |
| Morgan Stanley | CO | Headquarters | $5.53 | 0.0 | 500 |
| CA Internet (GeoLinks) | CA | Business Services | $4.50 | 41.3 | 138 |
| Fortive | CA | Manufacturing | $4.50 | 54.9 | 125 |
| Emerson Electric Co. | CO | Manufacturing | $4.28 | 100.0 | 252 |
Data Source: IncentivesFlow, a service from WAVTEQ Limited
Notable awards in the business services industry during the second quarter
Most projects are not nearly as sizable in terms of incentives offered as the top 20 highlighted above. Thus, we like to share notable Q2 projects garnering economic incentives in the business services and call center industries:
| Company | Destination State | Industry Function | Incentives Value (USD m) | Capex (USD m) | Jobs Created |
|---|---|---|---|---|---|
| Kainos | IN | Business Serv. | $3.30 | $0.80 | 133 |
| Amplitude | CA | Business Serv. | $2.80 | $11.30 | 149 |
| HealthEquity | UT | Business Serv. | $2.33 | $38.00 | 550 |
| North Mechan. Contract. | IN | Business Serv. | $2.10 | $2.13 | 150 |
| Artifact Uprising | CO | Business Serv. | $1.35 | $0.00 | 117 |
| Redtail Technology | CA | Business Serv. | $0.98 | $0.19 | 56 |
| Victra | NC | Call Center | $0.50 | $0.00 | 200 |
Data Source: IncentivesFlow, a service from WAVTEQ Limited
Conclusion
As noted above, the overall metrics of Q2 2020 are lower than Q2 2019. The decline in the total number of projects and other incentive metrics all likely reflect the impact of the economic disruption caused by the coronavirus pandemic. The start of this trend appears to have begun in the last month of Q1, when widespread shutdowns and occupancy restrictions were implemented nationwide. At this time, the long-term effects of the pandemic on economic incentives are yet to be determined. The ramifications of the virus will hinge on the domestic and international response to the pandemic and the speed of economic recovery.
We encourage companies to review their economic incentive portfolios amid this pandemic to ensure they are staying in compliance with project commitments. Site Selection Group can assist with reviewing economic incentive agreements and interfacing with governmental officials as needed.
Please note that the analysis above is based on publicly available data at the time of this blog. In addition, the current quarter’s data is compared to the information available at the time of prior quarterly blogs.
For additional information about these projects and others, please contact me at krendziperis@siteselectiongroup.com with any questions.
