Largest Economic Incentive Deals of First Quarter 2021
by Kelley Rendziperis, on May 18, 2021 1:24:04 PM
Site Selection Group estimates that in first quarter of 2021 more than $500 million in economic incentives were offered to attract various projects in the United States ranging from office projects, such as headquarters and data centers, to industrial facilities, including manufacturing plants and distribution centers. Incentives are a vital tool for state and local jurisdictions looking for an extra edge to make their communities more attractive and cost-effective for competitive projects.
To help understand economic incentive trends, this report evaluates economic incentive deals announced during the first quarter of 2021.
$535.2 million in economic incentives
As of the date of publication, Site Selection Group identified 383 economic incentive packages offered to companies across the United States during the first quarter of 2021. These economic incentive packages represent an estimated total incentive value of approximately $535.2 million. To garner these economic incentives, companies are expected to spend roughly $28.5 billion of capital and generate over 34,353 new jobs, resulting in:
- A total return on investment of approximately 1.9%;
- An average economic incentive award of $15,579 per new job;
- An average incentive award of approximately $1.40 million per project; and
- A median economic incentive award of approximately $200,000.
When compared to the first quarter of 2020, Q1 2021 showed a decrease of 11.3% in the number of announced projects from 432 to 383 projects. There were also declines in the total amount of announced economic incentive awards of 29.8% and number of new jobs of 2.2%; however, the amount of expected capital investment increased approximately 130% from the year-ago period.
The largest announced economic incentive award this quarter was by the Arizona Commerce Authority for Intel’s construction of two new semiconductor fabrication facilities at its existing campus in Chandler, Arizona. This project comes in the wake of Arizona’s announcement in 2020 of Taiwan Semiconductor Manufacturing Co.’s project, which was the second-largest incentive deal of that year.
The new Intel facilities will create 3,000 new jobs and bring an investment of approximately $20 billion. In return, the Authority has offered performance-based tax incentives worth $90 million. The second-largest incentive went to Mullen Technologies to establish a new manufacturing facility for electric vehicles in Memphis. The company was awarded $40.6 million in tax breaks via a payment-in-lieu-of-tax through the Economic Development Growth Engine for Memphis and Shelby County and is expected to invest over $360 million and create more than 430 new jobs.
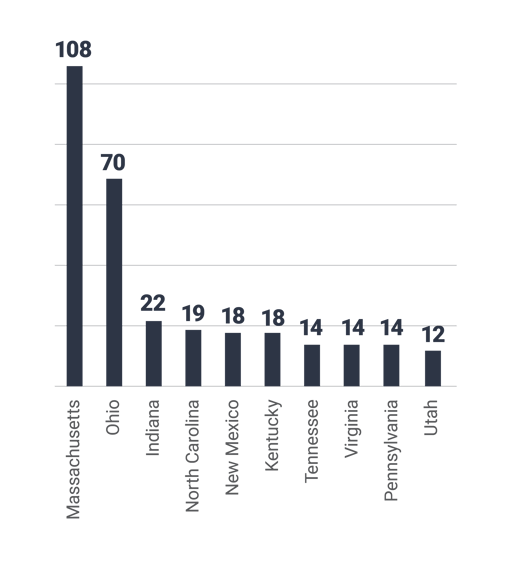
The 383 announced projects during the first quarter represented 26 states, led by Massachusetts with 108 announced projects and Ohio with 70. The large number of awards reported by Massachusetts is likely tied to the timing of when they announce workforce training funds. Arizona and Tennessee offered the largest amount of announced economic incentive awards with $90 million (for the Intel project in isolation) and $74.80 million (for 14 projects combined), respectively.
Top 10 States For Number of Announced Incentive Packages
 Data Source: IncentivesFlow, a service from WAVTEQ Limited
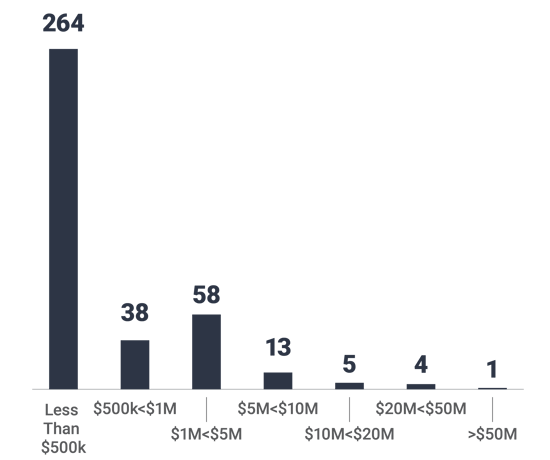
The following chart depicts the number of projects announced during the first quarter broken out by estimated economic incentive value:
Number of Projects by Incentive Value
 Data Source: IncentivesFlow, a service from WAVTEQ Limited
Approximately 78.9%, or 302 of the 383 announced projects, were awarded economic incentive packages valued at $1 million or less and 94% were awarded economic incentive packages valued at $5 million or less. While the average economic incentive package was valued at approximately $1.4 million for all announced projects, the average incentive package for the top 25 deals was approximately $14.3 million.
Economic incentives and industry trends
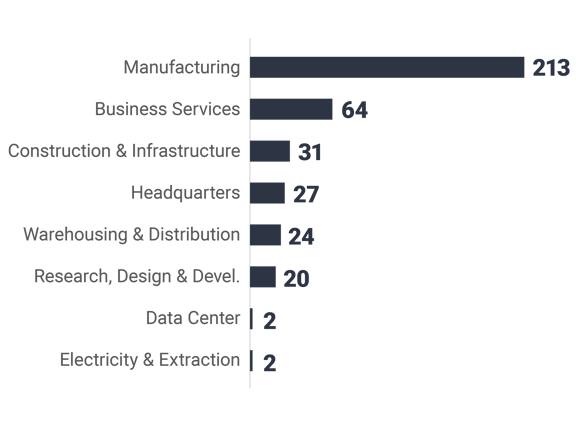
The following chart depicts the breakdown of the 383 announced projects during the first quarter of 2021 by industry function:
Number of Projects by Industry Function in Q1 2021
 Data Source: IncentivesFlow, a service from WAVTEQ Limited
Manufacturing continues to be the top incentivized industry this quarter fueled in part by the Intel and Mullen Technologies projects, as well as many other large projects including Eversana Life Science Services in Tennessee, the Plug Power facility in New York and Gilead Sciences in North Carolina. Beyond manufacturing, deals headquarters operations resulted in two of the largest awards: Domo and Route App, Utah projects that yielded a combined net increase of over 5,500 new jobs for those two projects alone.
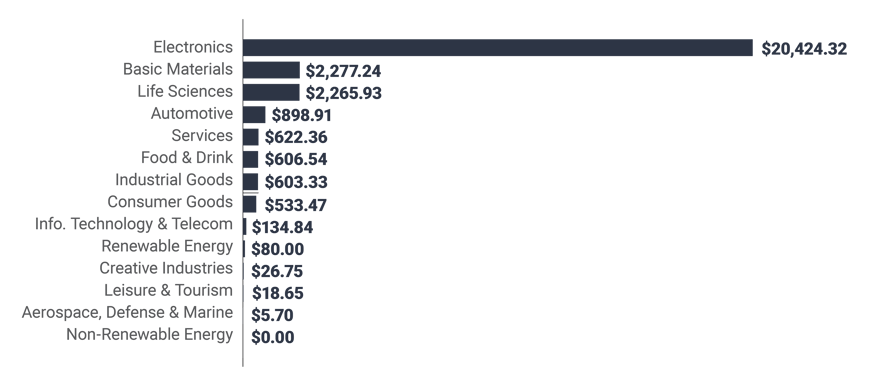
The chart below illustrates the level of capital investment committed by industry sector this quarter:
CapEx Value by Industry Sector in Q1 2021 (USD M)
 Source: IncentivesFlow, a service from WAVTEQ Limited
Looking at the amount of incentive awards by industry sector, the largest sector in terms of projected capital investment was electronics, which singlehandedly accounted for more than 71.6% of all the capital investment for the 383 projects during Q1 2021. The next largest industry sectors for capital investment include basic materials and life sciences, which together had a combined estimated capital investment of roughly $4.5 billion. The industry sector with the highest projected number of new jobs was the information technology and telecommunications sector with approximately 7,500 positions and the services sector projected to create approximately 5,500 new jobs.
Notable economic incentive packages in the first quarter
The top 25 economic incentive packages announced in the first quarter represent approximately $358.1 million of the total $535.2 million of estimated incentives for all projects, approximately 66.9%. These projects in isolation will account for:
- $25.25 billion of capital investment;
- 14,533 new jobs;
- A return on investment of approximately 1.4%; and
- $14,553 average award per new job.
The following table identifies some of the largest economic incentive deals (removing real estate development and film incentives) offered in Q1 2021. These projects provide a great way to benchmark the potential range of economic incentives for a variety of project types. However, it is important to understand these values are estimated and typically only reflect state-level incentives.
| Company | Location | Industry function | Incentives Value (USD m) | Capex (USD m) | Jobs Created |
| Intel | Chandler (AZ) | Manufacturing | $90.00 | $20,000.00 | 3,000 |
| Mullen Technologies | Memphis (TN) | Manufacturing | $40.60 | $362.40 | 434 |
| Domo | American Fork (UT) | Headquarters | $23.30 | $30.00 | 2,230 |
| Route App | Lehi (UT) | Headquarters | $23.20 | $17.30 | 3,353 |
| Merck & Co | Holly Springs (NC) | Research, Design & Dev. | $21.70 | $2,000.00 | 725 |
| Eversana Life Science Services | Memphis (TN) | Manufacturing | $13.90 | $30.00 | 50 |
| Gilead Sciences | Unspecified (NC) | Manufacturing | $13.30 | $5.00 | 275 |
| Plug Power | Henrietta (NY) | Manufacturing | $13.00 | $125.00 | 377 |
| Alliance RV | Elkhart (IN) | Manufacturing | $11.00 | $33.00 | 650 |
| Merit Corporation | Norfolk (VA) | Warehousing & Distrib. | $9.50 | $36.00 | 400 |
| Walgreens Boots Alliance | Indianapolis (IN) | Headquarters | $8.00 | $0.00 | 420 |
| Microvast Power Solutions | Clarksville (TN) | Headquarters | $8.00 | $240.00 | 287 |
| Hewlett Packard Enterprise | Chippewa Falls (WI) | Business Services | $8.00 | $22.00 | 30 |
| Jobvite | Indianapolis (IN) | Headquarters | $6.80 | $0.00 | 300 |
| Shin-Etsu Chemical Co | Multiple Locations (LA) | Manufacturing | $6.60 | $1,300.00 | 159 |
| EBTH | Blue Ash (OH) | Warehousing & Distrib. | $6.50 | $0.00 | 866 |
| Teel Plastics | Baraboo (WI) | Manufacturing | $6.10 | $0.00 | 59 |
| Elementus | Gramercy (LA) | Electricity & Extraction | $6.00 | $800.00 | 200 |
| Libbey Glass | Toledo (OH) | Manufacturing | $5.00 | $22.90 | 0 |
| Kinetic Advantage | Carmel (IN) | Headquarters (HQ) | $5.00 | $4.00 | 225 |
| Max Tool | Memphis (TN) | Warehousing & Distrib. | $4.20 | $20.90 | 35 |
Data Source: IncentivesFlow, a service from WAVTEQ Limited
Notable awards in the business services industry during the first quarter
Most projects are not nearly as sizable in terms of incentives offered as the top 20 highlighted above. Thus, we like to share notable Q1 projects garnering economic incentives in the business services industry:
| Company | Location | Industry function | Incentives Value (USD m) | Capex (USD m) | Jobs Created |
| NTT DATA Services | Nashville (TN) | Business Services | $3.50 | $9.90 | 350 |
| Wunderkind Corp | Indianapolis (IN) | Business Services | $3.40 | $3.00 | 225 |
| Scorpion | Unspecified (UT) | Business Services | $3.38 | $18.90 | 1,007 |
| Robinhood Markets | Charlotte (NC) | Business Services | $3.01 | $11.70 | 400 |
| Celigo | Indianapolis (IN) | Business Services | $2.50 | $1.20 | 150 |
| BNP Paribas | Wayne (PA) | Business Services | $1.99 | $0.00 | 300 |
| PennyMac Loan Services | Cary (NC) | Business Services | $1.91 | $4.30 | 300 |
| BASE Design-Build Group | Indianapolis (IN) | Business Services | $1.25 | $0.90 | 102 |
Data Source: IncentivesFlow, a service from WAVTEQ Limited
Conclusion
As noted above, capital investment in Q1 2021 increased by 130% over Q1 2020, but the number of projects, average award per job, number of jobs and the amount of incentives awarded are lower than they were during this same time last year in a continuation of a trend identified in our Q1 2020 article, where it appeared that many governmental agencies were not as aggressively awarding economic incentive packages. As the year progresses and the recovery from the COVID-19 pandemic continues, we will continue to analyze whether these changes continue.
Please note that the analysis above is based on publicly available data at the time of this blog. In addition, the current quarter’s data is compared to the information available at the time of prior quarterly blogs.
For additional information about these projects and others, please contact me at krendziperis@siteselectiongroup.com with any questions.
Contributions by Nancy O’Brien Ellis and Cody Gibbs.
