

by Kelley Rendziperis, on Apr 22, 2020 10:10:30 AM
To help understand economic incentive trends, this report evaluates economic incentive deals announced during the first quarter of 2020.
$762 million in economic incentives
As of the date of publication, Site Selection Group identified 432 economic incentive packages offered to companies across the United States during the first quarter of 2020. These economic incentive packages represent an estimated total incentive value of approximately $762 million. To garner these economic incentives, companies are expected to spend roughly $12.4 billion of capital and generate over 35,100 new jobs, resulting in:
- A total return on investment of approximately 6.1%;
- An average economic incentive award of $21,694 per new job;
- An average incentive award of approximately $1.74 million per project; and
- A median economic incentive award of approximately $240,000.
When compared to the first quarter of 2019, Q1 2020 had a drop in the number of projects by roughly 4%, from 451 to 432 projects. The largest declines were the total value of announced economic incentive awards (-36.2%), capital investment (-21.3%), and number of new jobs (-19.4%).
The largest announced economic incentive package this quarter was awarded to Sherwin-Williams Co. by the state of Ohio to support the construction of its new headquarters in Cleveland. The incentive package includes a $13.5 million construction grant, a $11.5 million job creation grant and $75 million in tax-increment financing. The project is expected to create 140 new jobs and retain 3,100 existing employees. The second largest incentive went to Northrop Grumman to establish a new headquarters facility in Roy, Utah. The company was awarded $59.9 million in tax credits through the Utah Economic Development TIF program and is expected to invest $380 million and create 2,250 new jobs.
The 432 announced projects during the first quarter represented 36 states, led by Massachusetts with 73 announced projects and Indiana with 60. Ohio and Indiana offered the largest value of announced economic incentives with $119.1 million and $104.6 million, respectively. The incentives offered by Ohio included the Sherwin-Williams project in Cleveland and two additional construction projects that were offered a total of $12 million.
The following chart depicts the number of projects announced during the first quarter broken out by estimated economic incentive value:
Number of Projects by Incentive Value
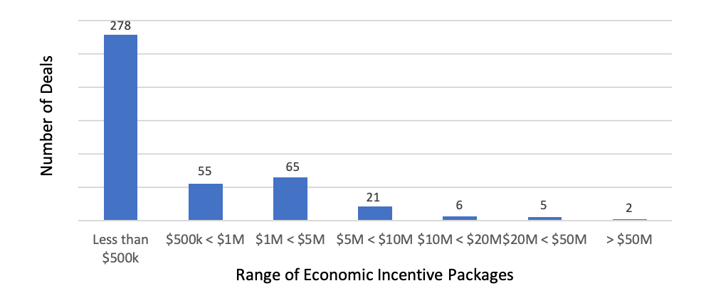
Data Source: IncentivesFlow, a service from WAVTEQ Limited
Approximately 77.1%, or 333 of the 432 announced projects, were awarded economic incentive packages valued at $1 million or less and 92.1% were awarded economic incentive packages valued at $5 million or less. While the average economic incentive package was valued at approximately $1.76 million for all 432 announced projects, the average package for the top 25 deals was approximately $20 million. Notably, the average award per project in Q1 2000 was much lower compared to prior quarters.
Economic incentives and industry trends
The following chart depicts the breakdown of the 432 announced projects during the first quarter of 2020 by industry function:
Number of Projects by Industry Function in Q1 2020
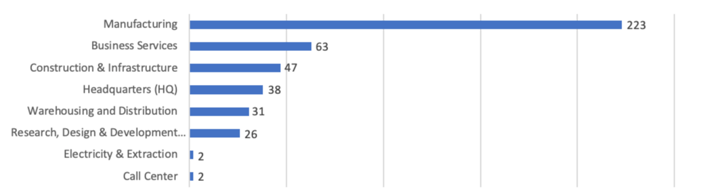
Data Source: IncentivesFlow, a service from WAVTEQ Limited
While manufacturing continues to be the top incentivized industry function this quarter, the top industry sectors for total estimated capital investment were the Services and Food & Drink sectors, which together account for nearly 49.6% of all the investment committed during this period. The Services sector included the expansion of UPS facilities in Tennessee and Pennsylvania, A Place for Mom which will build a new facility and create 600 new jobs in Overland Park, Kansas, and a $1.6 billion expansion by FedEx to expand its operations in Indianapolis, Indiana.
The chart below illustrates the level of capital investment committed by industry sector this quarter:
CapEx Value by Industry Sector in Q1 2020 (USD m)
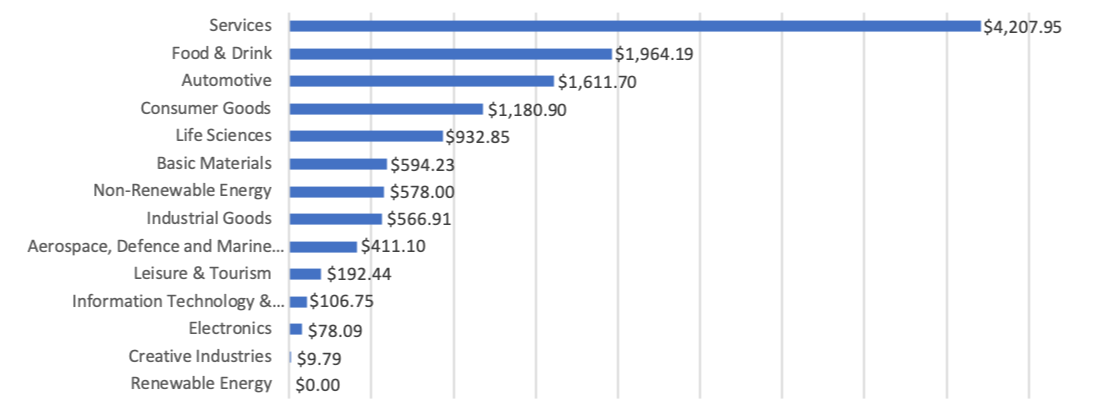
Source: IncentivesFlow, a service from WAVTEQ Limited
20 of the largest economic incentive packages in the first quarter
The top 25 economic incentive packages announced in the first quarter represent approximately $498.9 million of the total $762 million of estimated incentives for all projects, approximately 65.5%. These projects in isolation will account for:
- $4.5 billion of capital investment
- 10,602 new jobs
- A return on investment of approximately 11%
- $47,056 average award per new job
The following table identifies some of the largest economic incentive deals (removing real estate development and film incentives) offered in Q1 2020. These projects provide a great way to benchmark the potential range of economic incentives for a variety of project types. However, it is important to understand these values are estimated and typically only reflect state level incentives.
| Company | Location | Industry function | Incentives Value (USD m) | Capex (USD m) | Jobs Created |
|---|---|---|---|---|---|
| The Sherwin-Williams Co. | OH | Headquarters | $100.00 | $300.00 | 140 |
| Northrop Grumman | UT | Headquarters | $59.92 | $380.00 | 2,250 |
| United Parcel Service (UPS) | TN | Warehousing and Dist. | $38.03 | $217.00 | 25 |
| Corteva | IN | Research, Design & Dev. | $27.00 | $0.00 | 600 |
| Warrior Met Coal | AL | Electricity & Extraction | $26.00 | $578.00 | 350 |
| The DeLong Co. | WI | Warehousing and Dist. | $20.80 | $31.00 | 0 |
| Amazon | GA | Warehousing and Dist. | $19.25 | $238.00 | 1,000 |
| Pax8 (Project Sky) | CO | Business Services | $19.18 | $45.00 | 1,800 |
| WuXi AppTec Co. | MA | Manufacturing | $17.55 | $60.00 | 150 |
| A Place For Mom | KS | Business Services | $12.00 | $0.00 | 600 |
| Eli Lilly and Co. | NC | Manufacturing | $11.59 | $470.00 | 462 |
| TricorBraun Holdings | MS | Manufacturing | $10.05 | $0.00 | 5 |
| Dollar Tree | FL | Warehousing and Dist. | $9.90 | $0.00 | 255 |
| Nestle (Purina Pet Care) | IA | Warehousing and Dist. | $9.60 | $140.00 | 73 |
| Nestle USA | IN | Manufacturing | $9.00 | $200.00 | 30 |
| United Parcel Service (UPS) | PA | Warehousing and Dist. | $8.96 | $1,400.00 | 1,721 |
| CloudCheckr | NY | Headquarters | $8.00 | $6.70 | 397 |
| HEX | AK | Electricity & Extraction | $7.50 | $0.00 | 15 |
| The Kroger Co. | MD | Warehousing and Dist. | $7.15 | $0.00 | 400 |
| AGC Biologics | CO | Manufacturing | $6.48 | $100.00 | 280 |
Data Source: IncentivesFlow, a service from WAVTEQ Limited
Notable awards in the business services industry during the first quarter
Most projects are not nearly as sizable in terms of incentives offered as the top 20 highlighted above. Thus, we like to share notable Q1 projects garnering economic incentives in the business services and call center industries:
| Company | Location | Industry Function | Incentives Value (USD m) | Capex (USD m) | Jobs Created |
|---|---|---|---|---|---|
| TTEC | OK | Call Center | $0.50 | N/A | 283 |
| HCAS of Florida | SC | Call Center | $0.10 | N/A | 291 |
| Family Medical Partners | IN | Business Serv. | $5.48 | N/A | 10 |
| Project Coral | CO | Business Serv. | $4.90 | N/A | 465 |
| BlackRock | GA | Business Serv. | $4.00 | N/A | 1,000 |
| ByteCubed (U Group) | IN | Business Serv. | $3.65 | N/A | 130 |
| KPIT Technologies | IN | Business Serv. | $3.28 | $3.20 | 175 |
Data Source: IncentivesFlow, a service from WAVTEQ Limited
Conclusion
As noted above, the overall metrics of Q1 2020 are lower than Q1 2019. For example, the top 25 announced deals, as well as all other deals, show a decline in the average award per project. Perhaps this reflects the beginning of a trend of governmental agencies offering more moderate economic incentive packages. Moreover, it will be interesting to see how the coronavirus pandemic affects future metrics of announced economic incentive awards, especially since the impact on the global economy has not yet reached the full effect as of the writing of this blog. The ramifications of the virus will hinge on the domestic and international response to the pandemic and the speed of economic recovery.
We encourage companies to review their economic incentive portfolios amid this pandemic to ensure they are staying in compliance with project commitments. Site Selection Group can assist with reviewing economic incentive agreements and interfacing with governmental officials as needed.
Please note that the analysis above is based on publicly available data at the time of this blog. In addition, the current quarter’s data is compared to the information available at the time of prior quarterly blogs.
For additional information about these projects and others, please contact me at krendziperis@siteselectiongroup.com with any questions.
