

by King White, on Apr 22, 2020 10:10:59 AM
The COVID-19 pandemic caught all of us by surprise and ended the longest economic growth period in history. The brunt of the economic impact of the coronavirus is only starting which has caused employers of all types to lay off employees. In March, employment fell by 701,000 which is only a partial signal of what is coming our way. At the time of that employment survey (second week of March), no states had even issued complete stay-at-home orders. Food service alone lost 417,400 of those jobs. Temporary help, retail, manufacturing, construction, dentist and doctor offices, hotels, personal services and daycares also saw huge declines. There were a few sectors hiring: the federal government added 18,000 workers, retail superstores hired 7,900 employees, and warehousing — led by e-commerce —hired 8,200.
As a result of these layoffs, the unemployment rate rose from 3.5% to 4.4% which isn’t reflective of the true unemployment. If you add workers losing hours and other situations, it would have been 6.5%. Furthermore, most experts believe the unemployment rate will likely peak at 12% or more while the lockdowns persist. There are even some projections that say the employment rate could reach 20% to 30% in some metro areas. To help identify the metro areas with the greatest economic vulnerability, Site Selection Group analyzed newly released data that attempts to project which metro areas have the highest Vulnerability Index.
What is the COVID-19 Economic Vulnerability Index?
According to Chmura who developed the projections, the Vulnerability Index is a measurement of the negative impact that the coronavirus crisis can have on employment based upon a region's mix of industries. For example, accommodation and food services are projected to lose more jobs as a result of the coronavirus compared to utilities and healthcare. An average Vulnerability Index score is 100, representing the average job loss expected in the United States. Higher scores indicate the degree to which job losses may be greater — an index of 200, for example, means the rate of job loss can be twice as large as the national average. Conversely, an index of 50 would mean a possible job loss of half the national average. It is important to note that job losses are expected to be temporary for the length of the crisis. Consequential economic shocks are not incorporated into the index.
25 metro area with the greatest economic vulnerability
The following metro areas have the great economic vulnerability. As you will see from the cities on the list, the metro areas will have a heavy concentration of employment in the industries that are going to be the hardest hit such as hotels, restaurants, entertainment, retail and transportation.
25 Metro Areas with Greatest Economic Vulnerability Index
| Rank | Metro Area | Vulnerability Index |
|---|---|---|
| 1 | Kahului-Wailuku-Lahaina, HI | 194.92 |
| 2 | Atlantic City-Hammonton, NJ | 193.39 |
| 3 | Las Vegas-Henderson-Paradise, NV | 178.89 |
| 4 | Flagstaff, AZ | 163.94 |
| 5 | Ocean City, NJ | 161.71 |
| 6 | Norwich-New London, CT | 157.75 |
| 7 | Myrtle Beach-Conway-North Myrtle Beach, SC-NC | 155.45 |
| 8 | Gulfport-Biloxi, MS | 145.12 |
| 9 | Orlando-Kissimmee-Sanford, FL | 143.42 |
| 10 | East Stroudsburg, PA | 140.41 |
| 11 | Brunswick, GA | 138.91 |
| 12 | Hilton Head Island-Bluffton, SC | 135.95 |
| 13 | Hot Springs, AR | 135.77 |
| 14 | Daphne-Fairhope-Foley, AL | 135.4 |
| 15 | Naples-Marco Island, FL | 134.37 |
| 16 | Santa Fe, NM | 132.77 |
| 17 | Urban Honolulu, HI | 130.37 |
| 18 | Barnstable Town, MA | 129.42 |
| 19 | Kokomo, IN | 124.94 |
| 20 | Salisbury, MD-DE | 124.82 |
| 21 | Crestview-Fort Walton Beach-Destin, FL | 123.68 |
| 22 | Savannah, GA | 123.11 |
| 23 | Reno, NV | 121.88 |
| 24 | Napa, CA | 121.69 |
| 25 | New Orleans-Metairie, LA | 121.31 |
25 metro areas with the lowest economic vulnerability
The following metro areas have the least vulnerable economies. These cities will typically have a low concentration of the highest risk occupations in such as government, utilities, real estate, construction and technology.
25 Metro Areas with Lowest Economic Vulnerability Index
| Rank | Metro Area | Vulnerability Index |
|---|---|---|
| 1 | Trenton-Princeton, NJ | 70.05 |
| 2 | Jefferson City, MO | 70.62 |
| 3 | California-Lexington Park, MD | 72.34 |
| 4 | Springfield, IL | 73.12 |
| 5 | Midland, MI | 75.3 |
| 6 | Pine Bluff, AR | 80.1 |
| 7 | Topeka, KS | 83.63 |
| 8 | Vineland-Bridgeton, NJ | 83.63 |
| 9 | El Centro, CA | 84.26 |
| 10 | Lewiston-Auburn, ME | 84.33 |
| 11 | Durham-Chapel Hill, NC | 84.37 |
| 12 | Albany-Schenectady-Troy, NY | 84.46 |
| 13 | Bakersfield, CA | 84.54 |
| 14 | San Jose-Sunnyvale-Santa Clara, CA | 84.71 |
| 15 | Merced, CA | 84.94 |
| 16 | Dalton, GA | 85.23 |
| 17 | Albany-Lebanon, OR | 85.45 |
| 18 | Greeley, CO | 85.53 |
| 19 | Washington-Arlington-Alexandria, DC-VA-MD-WV | 85.87 |
| 20 | Visalia, CA | 85.97 |
| 21 | Kennewick-Richland, WA | 86.14 |
| 22 | Logan, UT-ID | 87 |
| 23 | Baton Rouge, LA | 87.11 |
| 24 | Provo-Orem, UT | 87.17 |
| 25 | Walla Walla, WA | 87.34 |
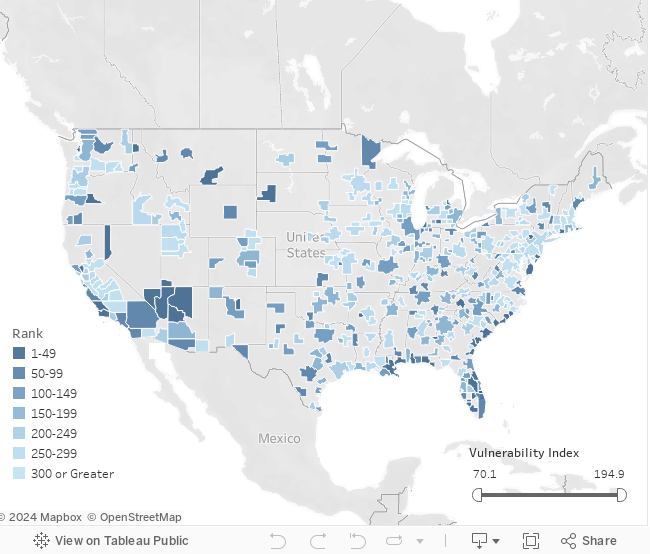
Comparison of all 384 metro areas
To review the index for all 384 metro areas, please use the below interactive map to view the projections across the United States.
Conclusions
The COVID-19 crisis is an unexpected global tragedy that has left all of us shell-shocked. Data projections utilized in this report can be indictive of what might happen; however, it surely will not predict the future. We are blessed by living in the best country in the world, and we have successfully made it through other tragic events such as this. Let’s hope for a speedy recovery and more importantly, a cure for the deadly coronavirus.
Data Source: Chmura Economics & Analytics, JobsEQ
