

by Josh Bays, on Mar 24, 2020 3:26:41 PM
Note from the author: This research was conducted prior to the United States feeling its first meaningful impact of the coronavirus. It can be expected that the trends presented in this blog will be significantly disrupted in the near future.
Demand for production workers continues to be a critical factor when evaluating a labor market. Labor demand can tell potential employers many things about a market: competitive pressures, relative ease of hiring, and geographic trends, to name a few. In any site selection exercise, labor demand should be used in conjunction with other factors to verify that a skilled workforce is available. This is especially critical in high-headcount operations, such as manufacturing and production. In its engagements with corporate clients, Site Selection Group, a full-service location advisory, economic incentives and real estate services firm, utilizes various job postings data as a proxy for job demand. Since our previous analysis, job demand for production occupations has experienced significant growth.
Job postings as an indicator for pressure
Site Selection Group’s analysis utilizes two important facets of job postings. The first is unique postings, that is, postings for a single job opening rather than the total amount of postings overall. This considers the multiple avenues employers might use to source candidates. The amount of unique job postings by itself speaks to the amount of hiring activity within a market. The second important measure to consider is how many places and times an employer needs to advertise the same job. This indicator, referred to as posting intensity, gives a relative metric for how “hard” employers need to work to hire. A lower intensity implies a candidate was hired relatively quickly.
Metro areas with the highest growth in demand for production labor
Looking at unique postings isolated from other factors can be misleading, as larger markets will naturally have more postings. Therefore, Site Selection Group measured the growth in unique production postings from the past 12 months (March 2019-February 2020) compared to the preceding 12 months among top U.S. metro areas. To prevent small market outliers, this analysis filters out those markets with less than 10,000 people employed in production occupations. The chart below displays those metros with the highest demand growth.
| Metro Area | Growth in Demand |
|---|---|
| Racine, WI | 73.03% |
| Tupelo, MS | 71.44% |
| El Paso, TX | 60.42% |
| Oshkosh-Neenah, WI | 54.76% |
| Fort Smith, AR-OK | 53.41% |
| Sheboygan, WI | 53.25% |
| Gulfport-Biloxi, MS | 52.67% |
| York-Hanover, PA | 52.07% |
| Jacksonville, FL | 51.85% |
| Washington-Arlington-Alexandria, DC-VA-MD-WV | 51.21% |
| Milwaukee-Waukesha, WI | 50.71% |
| LaGrange, GA-AL | 49.02% |
| Albuquerque, NM | 48.87% |
| Las Vegas-Henderson-Paradise, NV | 45.44% |
| Columbus, OH | 44.34% |
| Appleton, WI | 44.30% |
| Albertville, AL | 43.75% |
| Lancaster, PA | 43.74% |
| Tuscaloosa, AL | 43.68% |
| Green Bay, WI | 42.88% |
The growth in demand for production workers is geographically diverse, with markets all over the country experiencing high year-over-year growth.
Geographic trends in postings intensity
After identifying a market of interest, it can be very useful to further segment the market, particularly when examining mega-markets where one side of the market can offer distinct advantages over another. The interactive map below displays counties with lower posting intensity in green, and relatively higher postings intensity in red.
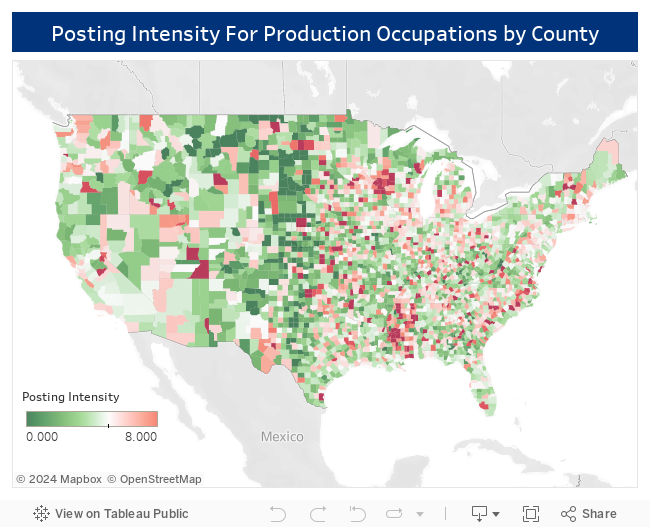
This data piece demonstrates the relative advantage of locating on the periphery of a larger market. As the map shows, there is generally less competition for production labor outside the center of a market. However, the significant advantage of access to a large labor pool still exists.
Source: EMSI, Production Occupations (51-0000)
