

by Josh Bays, on Jan 26, 2021 11:50:22 AM
After COVID-19 inserted substantial uncertainty into the market in March 2020 which continued through the second quarter, those associated with domestic industrial site selection projects will attest that the manufacturing sector remained incredibly active for the remainder of the year. And based on our anecdotal pulse on the market, the upward trend in activity is continuing well into 2021.
Site Selection Group, a full-service location advisory, economic incentive and real estate services firm, monitors critical industrial site selection data metrics to help our clients make informed location decisions. Many of our manufacturing clients are surprised to hear how tight resources have become in the middle of a global pandemic, specifically manufacturing workforce and industrial real estate.
One of the more frustrating aspects of data analytics in site selection is that most “traditional” data sources lag upward of one year. Therefore, it is difficult to assess the impact that significant economic events — such as the pandemic — are having on the marketplace in real time. However, there are a few reliable near-real time data variables, and this blog will help us understand key manufacturing site selection trends from 2020.
Trending unemployment data and job posting intensity suggest a tight manufacturing workforce
The chart below shows the national manufacturing sector unemployment rate by quarter compared to the overall national unemployment rate. The national manufacturing unemployment rate remained below the overall national unemployment rate until the end of Q4 2020, and the closing of this gap has less to do with rising manufacturing unemployment as it did with overall economic recovery.
Also included in the chart below is manufacturing job posting intensity by quarter. This is the measure of the number of unique manufacturing job postings in a given time period (quarter) relative to the number of total manufacturing jobs. Surprisingly, manufacturing job posting activity remained constant and appeared unaffected by unemployment.
National Workforce Indicators | Production Sector
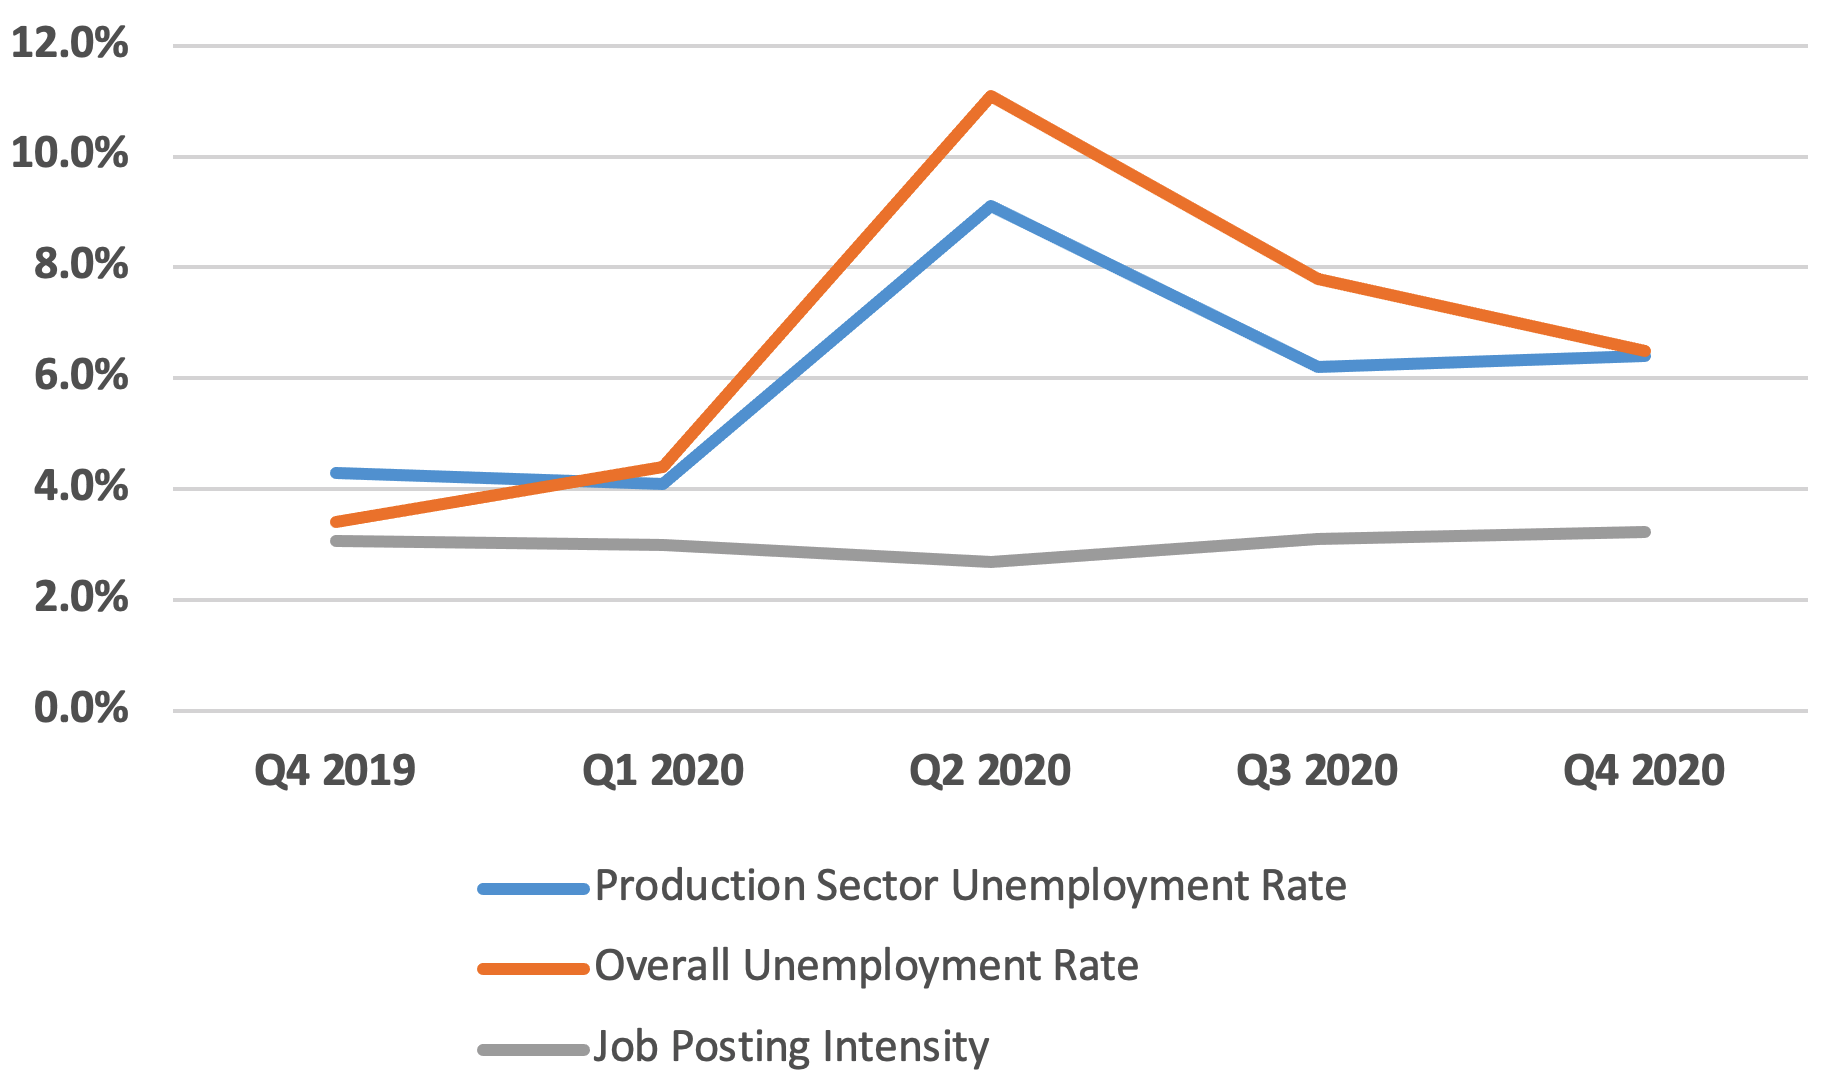
Source: EMSI, BLS
The chart below shows total national manufacturing unemployment relative to overall national unemployment. In a relative sense, the manufacturing sector appears to be employing workers at a much faster rate than the overall workforce. It will be interesting if Q1 2021 unemployment data supports this trend.
Production Unemployment Relative to Overall Unemployment
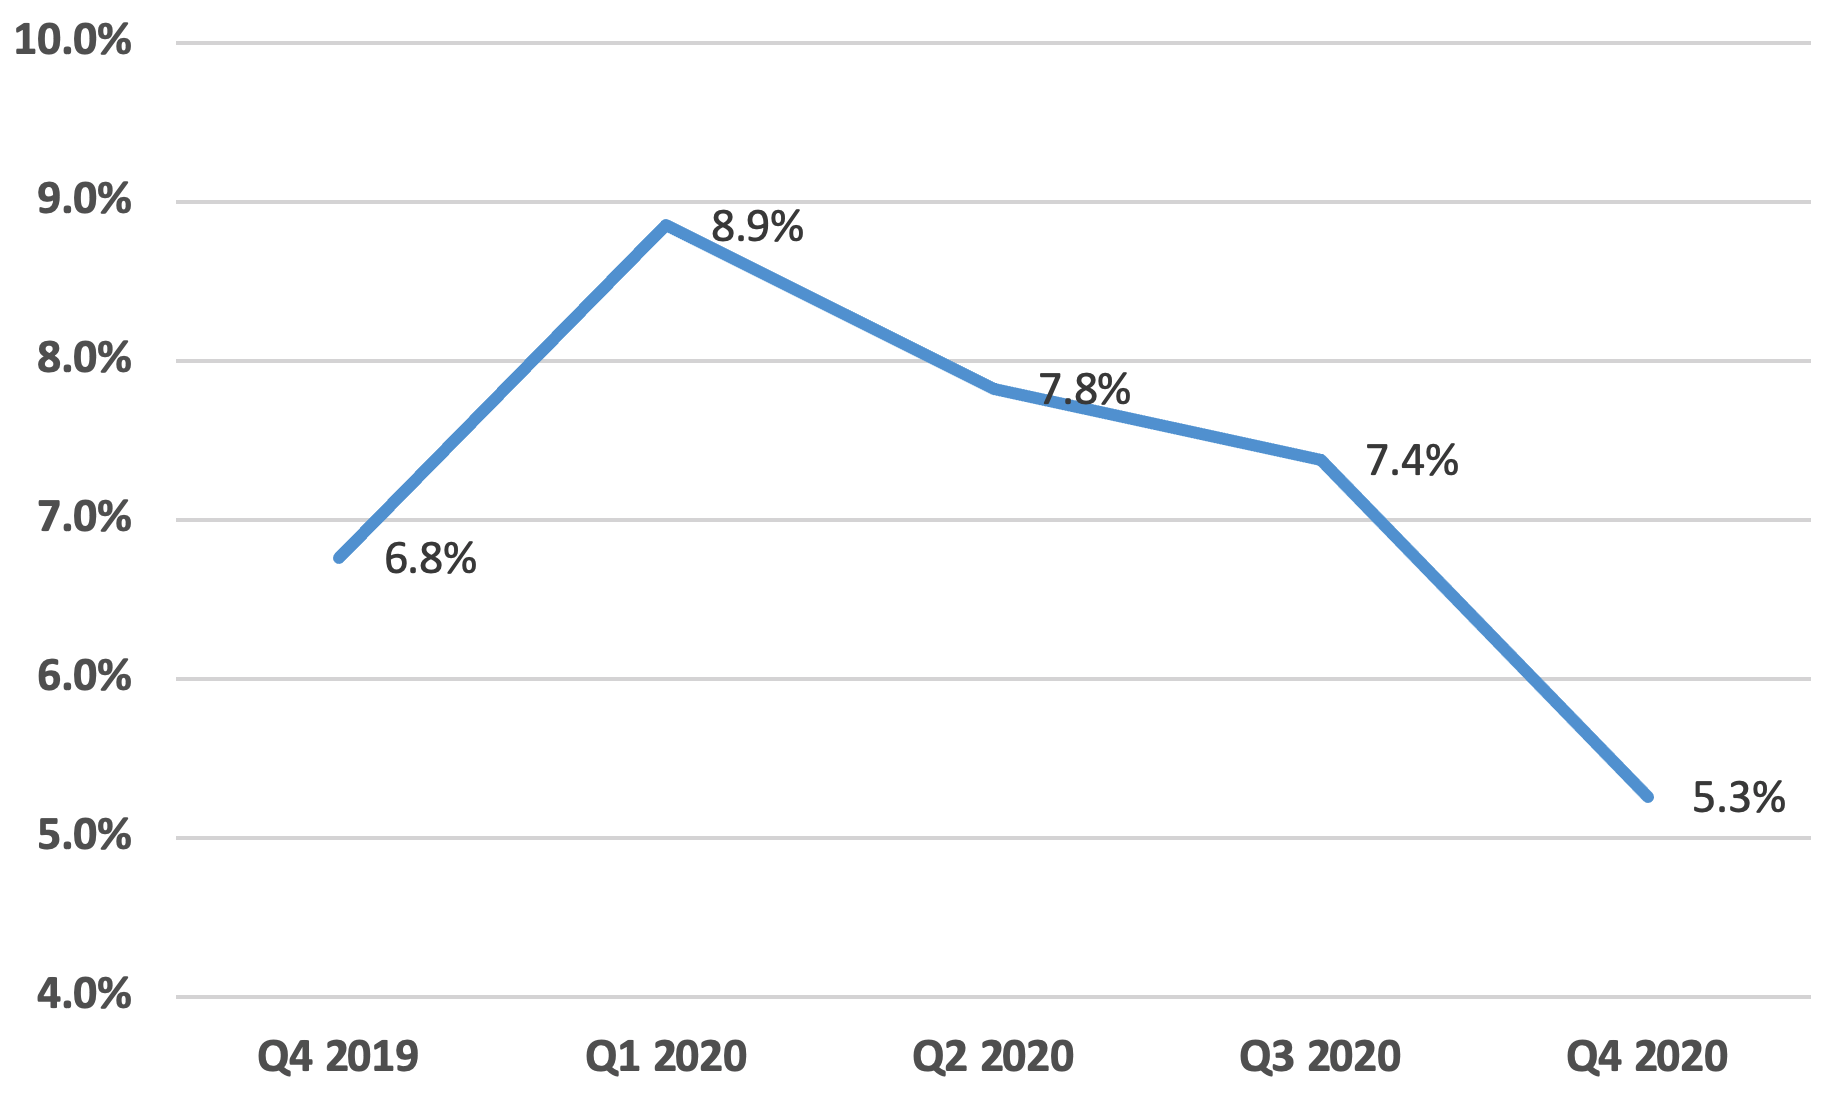
Source: EMSI, BLS
The table below shows which metro areas had the most and least drastic changes in manufacturing job posting intensity. The first column shows the annual change from Q4 2019 to Q4 2020 and the second column shows the change from Q2 2020 (when unemployment spiked) to Q4 2020. In a general sense, companies in those metro areas in the Top 5 were posting manufacturing jobs at a much higher rate by the end of 2020 than they were six months earlier, indicating a tightening manufacturing labor market.
Changes in Manufacturing Job Posting Intensity
| Change Q4'19 - Q4'20 | Change Q2'20 - Q4'20 | |
|---|---|---|
| TOP 5 | ||
| Worcester, MA | 61.7% | 69.3% |
| Omaha, NE | 28.6% | 57.0% |
| Tulsa, OK | -14.2% | 52.3% |
| Sacramento, CA | 36.4% | 50.5% |
| Orlando, FL | 8.3% | 47.9% |
| BOTTOM 5 | ||
| Cincinnati, OH | 2.8% | 0.6% |
| Houston, TX | -26.3% | 0.1% |
| Charlotte, NC | -1.1% | -1.4% |
| Denver, CO | -11.5% | -16.6% |
| Austin, TX | -10.1% | -24.3% |
Source: EMSI, BLS
Industrial real estate statistics supports the pain manufacturers feel when trying to secure a building
Although industrial real estate statistics are geared more toward the distribution sector than manufacturing sector, they are a good indicator of availability and cost pressures in the marketplace.
The chart below shows national industrial vacancy rates over the last eight quarters. Although it appears vacancy rates climbed minimally until Q3 2020 before a downward trend to end the year, much of the slightly increased vacant space was due to new deliveries of speculative construction.
National Industrial Vacancy Rate
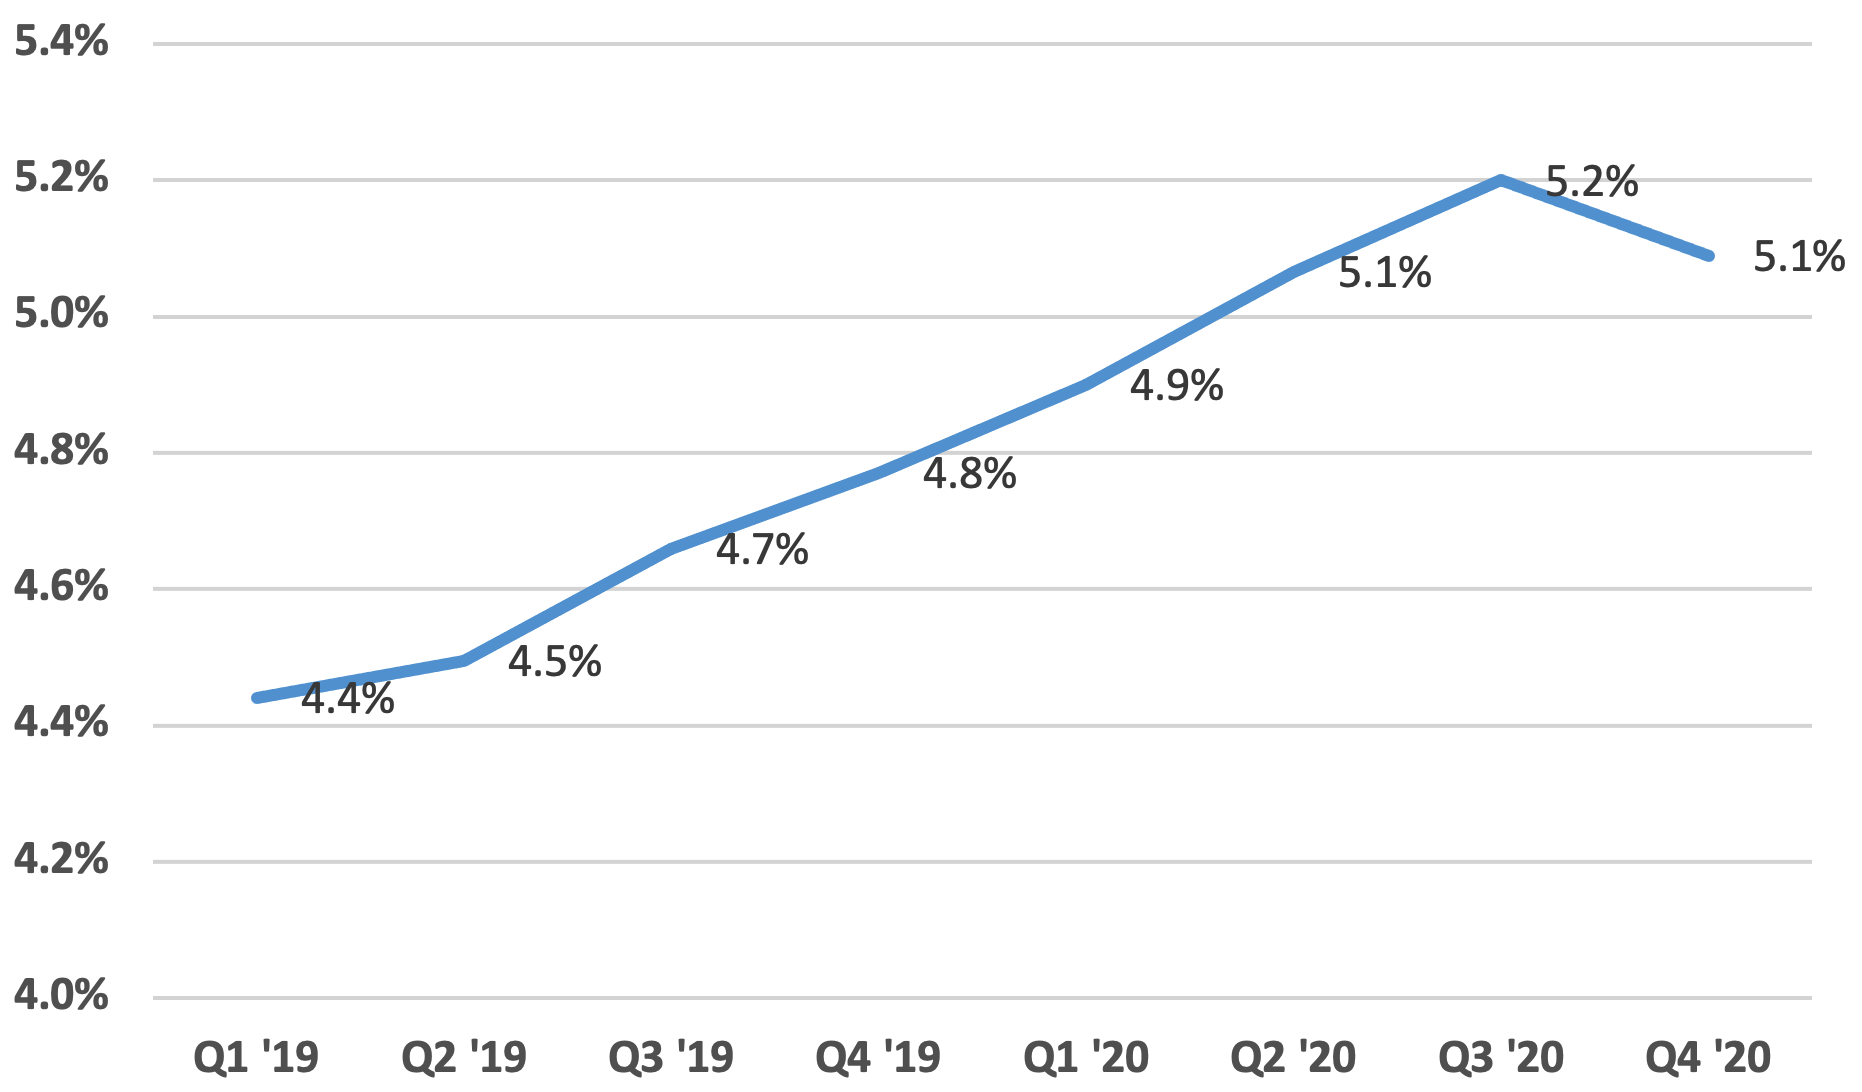
Source: CoStar
The table below shows the five markets with the highest and lowest industrial vacancy rates. As demonstrated later in this blog, a flood of speculative construction is certainly driving higher vacancy rates in active markets such as Dallas-Fort Worth and Phoenix.
Industrial Vacancy Rate - Q4'20
| TOP 5 | |
|---|---|
| Houston, TX | 8.6% |
| Baltimore, MD | 7.7% |
| Phoenix, AZ | 7.2% |
| Dallas-Fort Worth, TX | 7.1% |
| San Antonio, TX | 7.0% |
| BOTTOM 5 | |
| Los Angeles, CA | 3.3% |
| Norfolk, VA | 3.2% |
| Birmingham, AL | 2.9% |
| Albany, NY | 2.7% |
| Toledo, OH | 1.6% |
Source: CoStar
The increase in industrial activity is further evidenced by an increase in national industrial market rents. The chart below shows the average gross industrial rental rate by quarter, as well as a rolling annual escalation by quarter. Industrial rents increased 4.25% from the end of 2019 to the end of 2020.
