

by Josh Bays, on Jan 26, 2021 11:49:33 AM
After COVID-19 inserted substantial uncertainty into the market in March 2020 which continued through the second quarter, it had far less impact later in the year. Those associated with domestic industrial site selection projects will attest that the distribution sector remained incredibly active for the remainder of 2020. And, based on our anecdotal pulse on the market, the upward trend in activity is continuing well into 2021.
Site Selection Group, a full-service location advisory, economic incentive and real estate services firm, monitors critical industrial site selection data metrics to help our clients make informed location decisions. The majority of our distribution center clients are aware of 2020’s hyper-active market, but a few are surprised to learn the impact the increased activity had on two key location drivers, distribution workforce and industrial real estate.
One of the more frustrating aspects of data analytics in site selection is that most “traditional” data sources lag upward of one year. Therefore, it is difficult to assess the impact that significant economic events — such as the pandemic — are having on the marketplace in real time. However, there are a few reliable near-real time data variables, and this blog will help us understand key distribution site selection trends from 2020.
Trending unemployment data and job posting intensity suggest a tightening distribution center workforce
The chart below shows the national distribution sector unemployment rate by quarter compared to the overall national unemployment rate. Despite the activity in projects, the national distribution center unemployment rate remained elevated above the overall national unemployment rate, and both spiked by the end of Q2 2020.
Also included in the chart below is distribution job posting intensity by quarter. This is the measure of the number of unique distribution center job postings in a given time period (quarter) relative to the number of total distribution center jobs. As one would expect, the job postings data was highly correlated to distribution center unemployment. As unemployment rose, companies posted less jobs; as unemployment fell, companies posted more jobs.
National Workforce Indicators | Distribution Sector
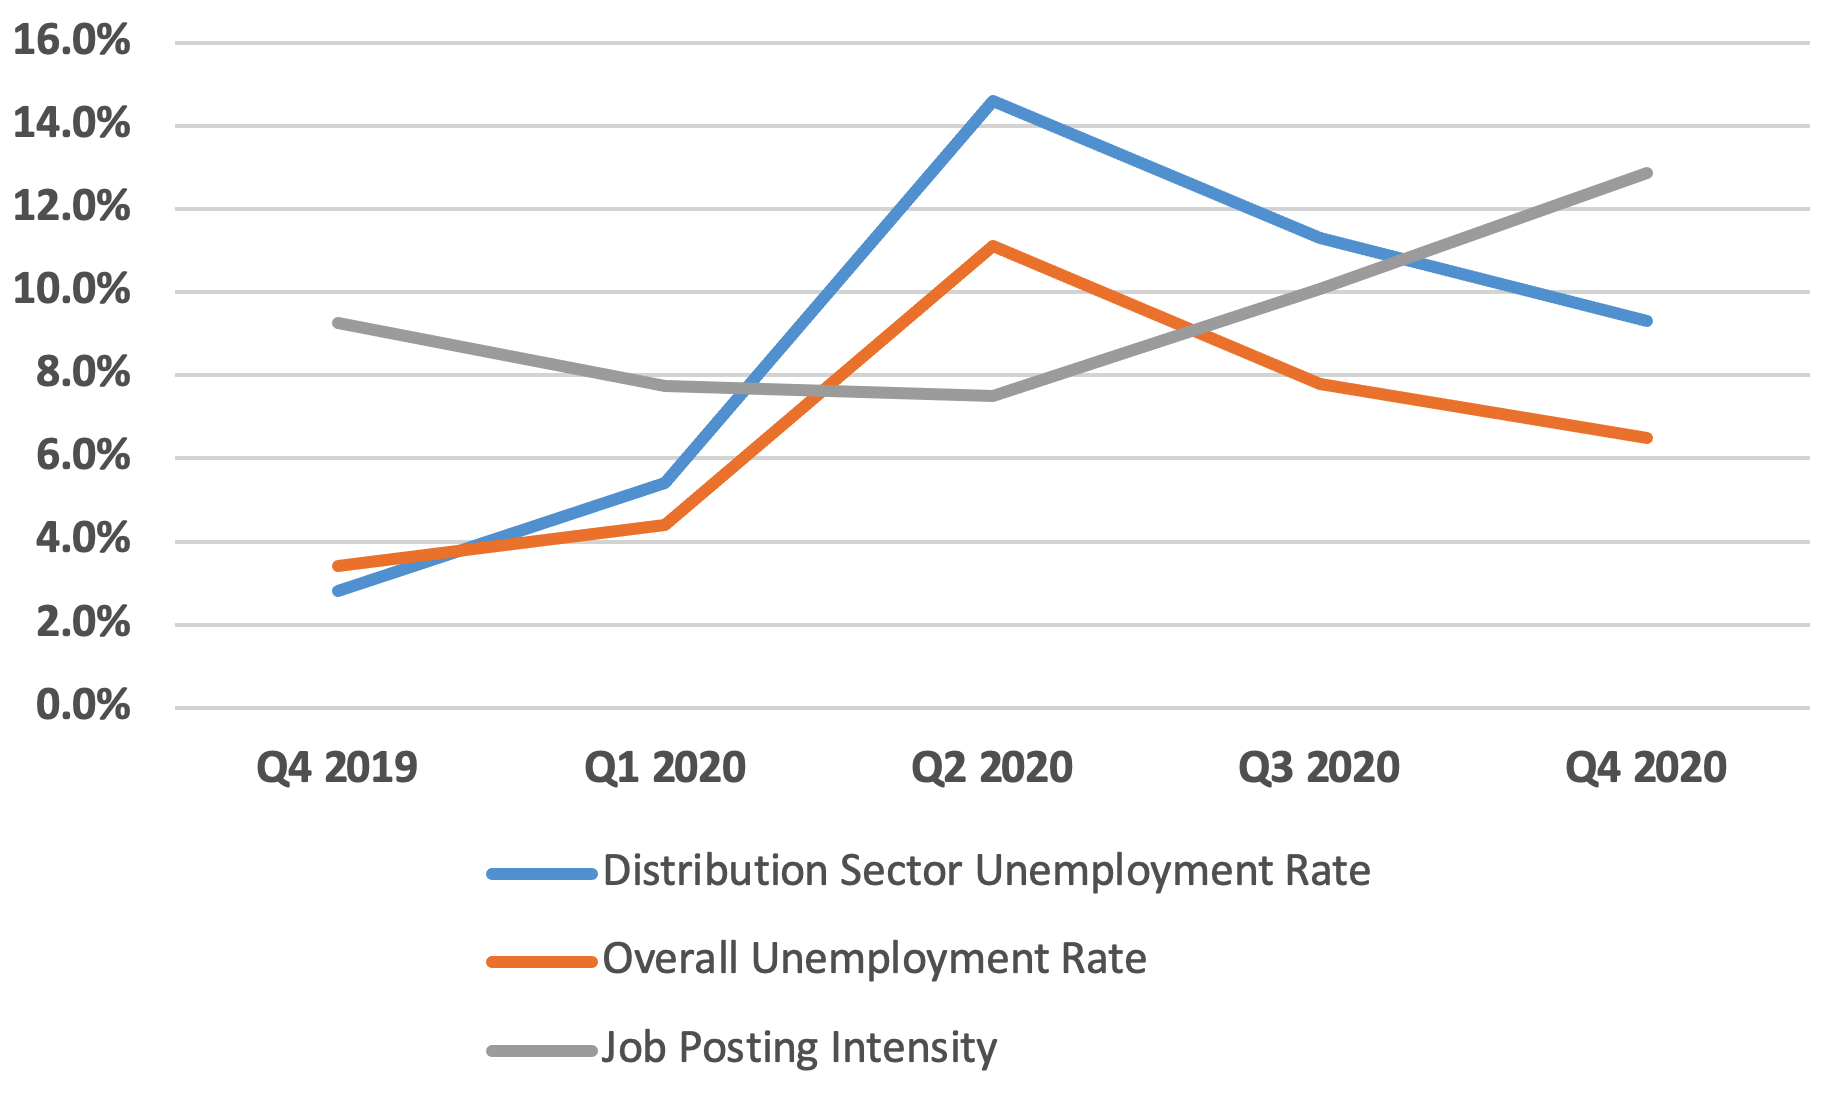
Source: EMSI, BLS
The chart below shows total national distribution unemployment relative to overall national unemployment. In a relative sense, the distribution center sector appears to be employing workers at a faster rate than the overall workforce.
Distribution Unemployment Relative to Overall Unemployment
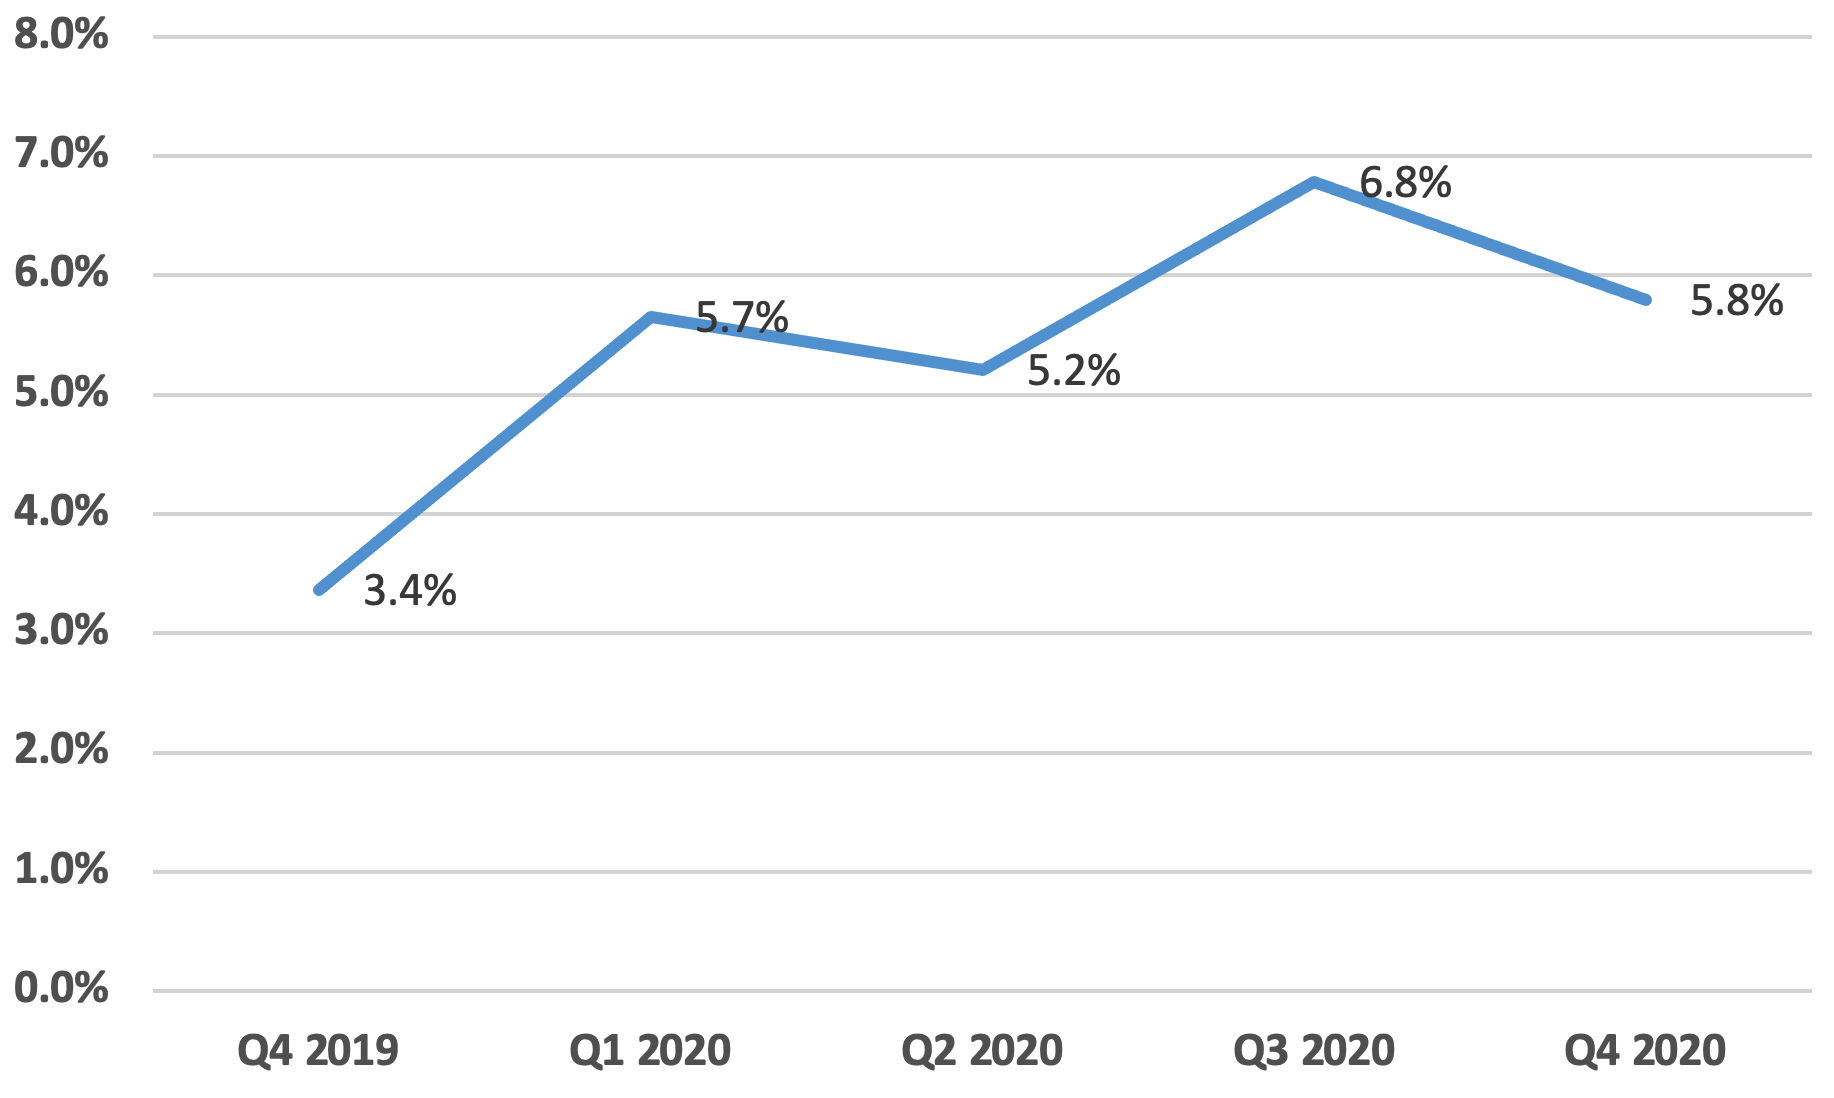
Source: EMSI, BLS
The table below shows which metro areas had the most and least drastic changes in distribution center job posting intensity. The first column shows the annual change from Q4 2019 to Q4 2020 and the second column shows the change from Q2 2020 (when unemployment spiked) to Q4 2020. In a general sense, companies in those metro areas in the Top 5 were posting distribution center jobs at a much higher rate by the end of 2020 than they were six months earlier, indicating a tightening distribution center labor market. Interestingly, companies in metro areas in the Bottom 5 were still posting jobs 50% more frequently at the end of 2020 than six months prior which suggests that distribution center labor is tight across the nation.
Changes in Distribution Job Posting Intensity
| Change Q4'19 - Q4'20 | Change Q2'20 - Q4'20 | |
|---|---|---|
| TOP 5 | ||
| Salt Lake City, UT | 61.3% | 120.6% |
| Riverside, CA | 77.2% | 113.6% |
| Tampa, FL | 59.7% | 109.8% |
| Worcester, MA | 70.8% | 103.5% |
| Boston, MA | 71.3% | 100.4% |
| BOTTOM 5 | ||
| San Antonio, TX | 8.3% | 54.0% |
| Charlotte, NC | 26.6% | 51.5% |
| Houston, TX | 9.1% | 51.0% |
| Dallas, TX | 29.1% | 50.9% |
| Denver, CO | 29.5% | 21.0% |
Source: EMSI, BLS
Industrial real estate statistics further highlight distribution center activity
The chart below shows national industrial vacancy rates over the last eight quarters. Although it appears vacancy rates climbed minimally until Q3 2020 before a downward trend to end the year, much of the slightly increased vacant space was due to new deliveries of speculative construction.
National Industrial Vacancy Rate
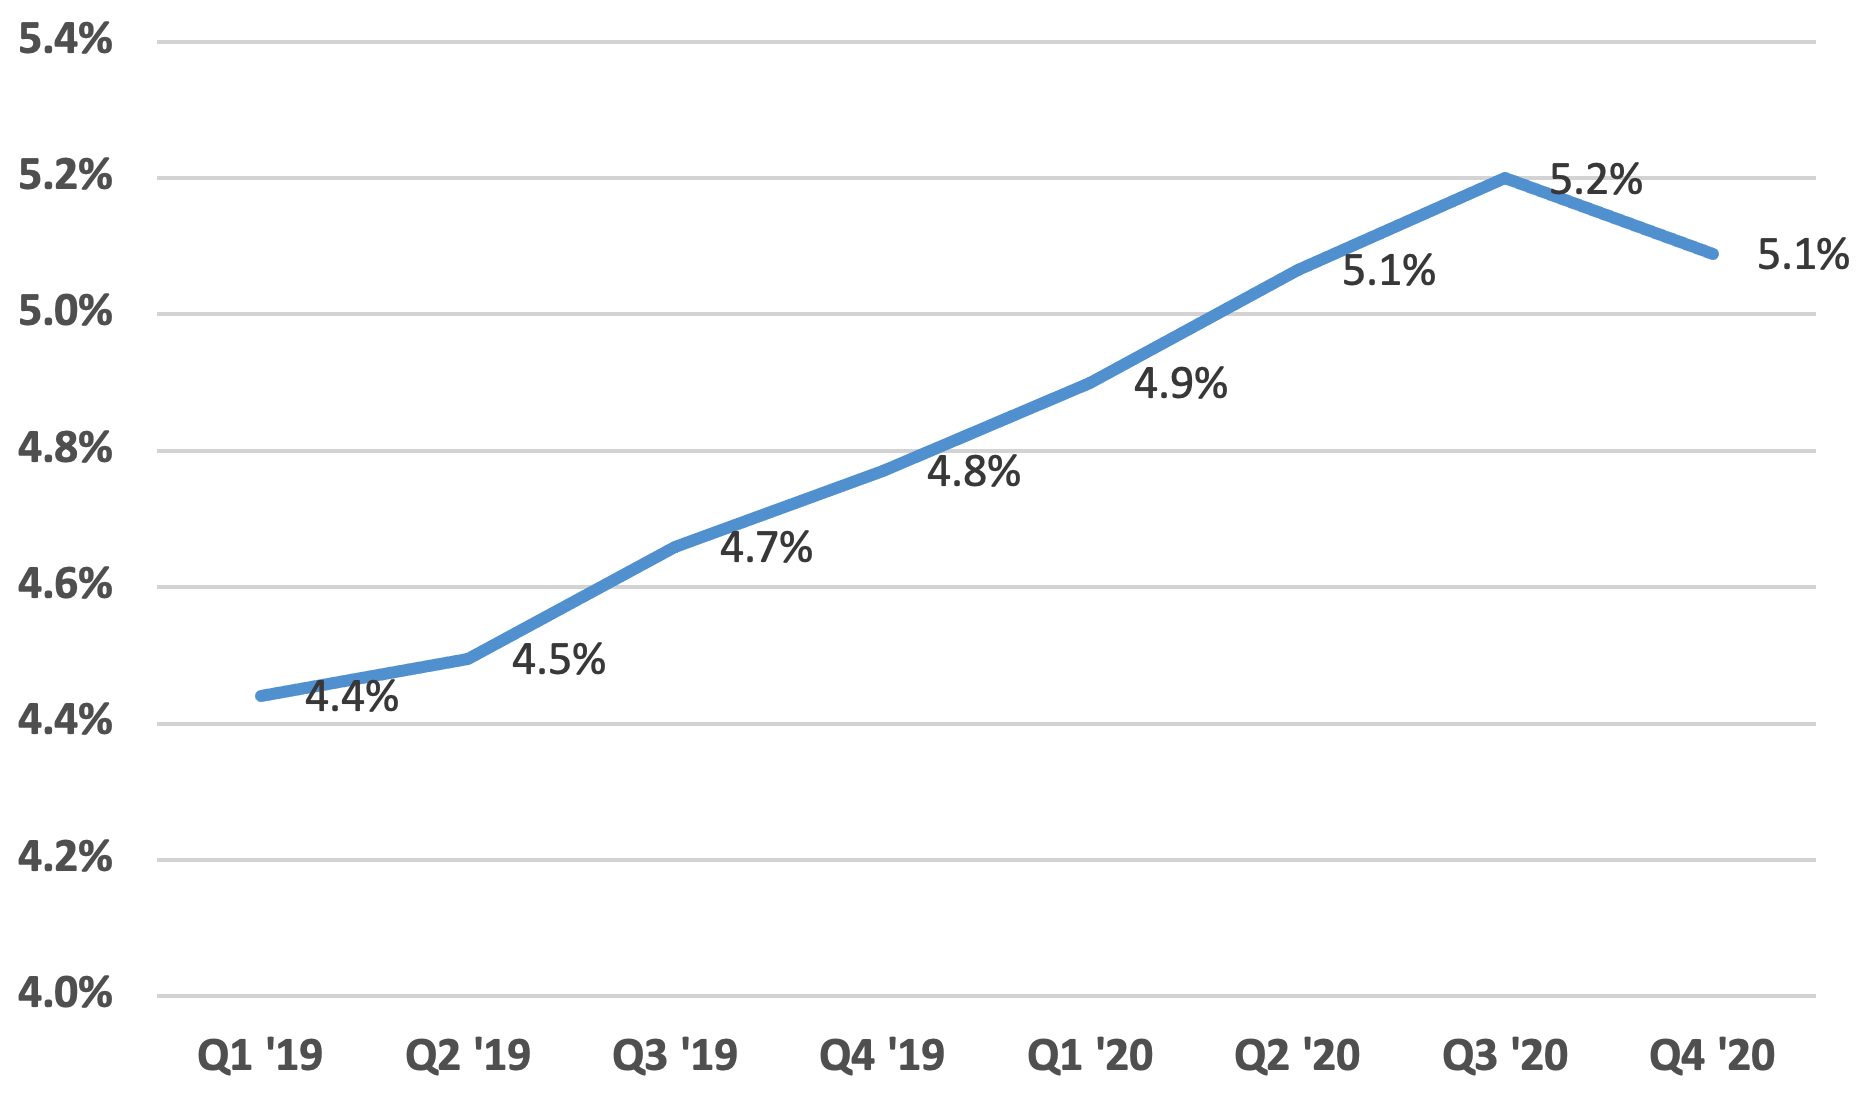
Source: CoStar
The table below shows the five markets with the highest and lowest industrial vacancy rates. As demonstrated later in this blog, a flood of speculative construction is certainly driving higher vacancy rates in active markets such as Dallas-Fort Worth and Phoenix.
Industrial Vacancy Rate - Q4'20
| TOP 5 | |
|---|---|
| Houston, TX | 8.6% |
| Baltimore, MD | 7.7% |
| Phoenix, AZ | 7.2% |
| Dallas-Fort Worth, TX | 7.1% |
| San Antonio, TX | 7.0% |
| BOTTOM 5 | |
| Los Angeles, CA | 3.3% |
| Norfolk, VA | 3.2% |
| Birmingham, AL | 2.9% |
| Albany, NY | 2.7% |
| Toledo, OH | 1.6% |
Source: CoStar
The increase in distribution activity is further evidenced by an increase in national industrial market rents. The chart below shows the average gross industrial rental rate by quarter, as well as a rolling annual escalation by quarter. Industrial rents increased 4.25% from the end of 2019 to the end of 2020.
2020 Gross Industrial Rent by Quarter
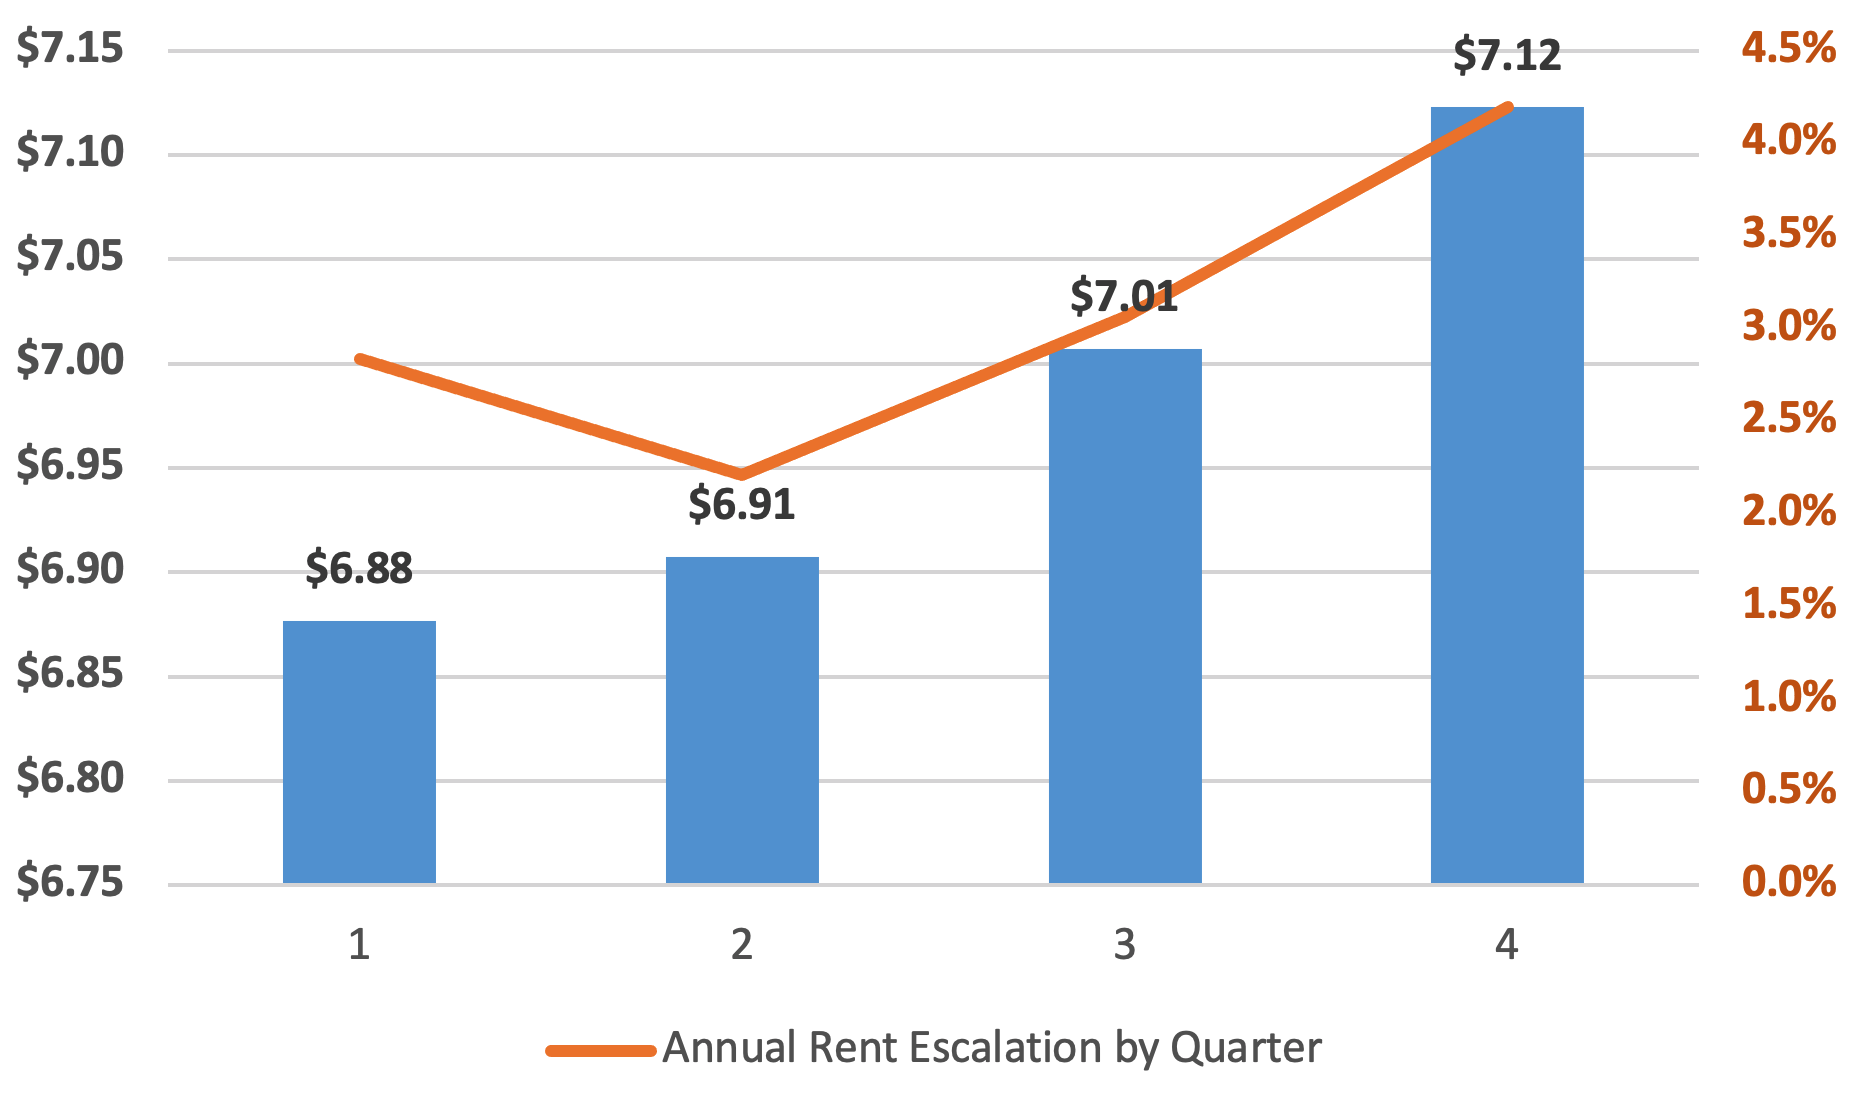
Source: CoStar
The table below shows the five markets with the least (decreased) and most (increased) rent escalation from Q4 2019 to Q4 2020.
| Gross Rent Q4 '20 ($/Sq.Ft.) | Annual Rent Escalation Q4 '20 | |
|---|---|---|
| TOP 5 | ||
| Sacramento, CA | $7.25 | -13.5% |
| Miami, FL | $10.83 | -10.6% |
| Kansas City, MO | $4.62 | -4.9% |
| Minneapolis, MN | $5.60 | -4.8% |
| Milwaukee, WI | $4.37 | -2.0% |
| BOTTOM 5 | ||
| San Antonio, TX | $7.20 | 13.2% |
| Memphis, TN | $3.62 | 13.6% |
| Worcester, MA | $6.01 | 15.9% |
| Birmingham, AL | $4.85 | 16.3% |
| Pittsburgh, PA | $6.26 | 18.8% |
Source: CoStar
One of the most interesting industrial real estate trends to follow is construction activity. The table below shows the five markets with the most industrial square footage under construction as of the end of Q4 2020. Dallas-Fort Worth is significantly outpacing the country as it relates to speculative construction which explains its higher vacancy rates. One of the most interesting industrial site selection trends of 2020 is the increase in industrial construction the greater Nashville region has experienced over the last 12 months.
| Industrial Sq.Ft. Under Construction as of Q4 '20 | Annual Change in Industrial Construction Q4 '20 | |
|---|---|---|
| Dallas-Fort Worth - TX | 32,023,220 | 2.3% |
| Chicago - IL | 20,763,594 | 9.1% |
| Atlanta - GA | 20,371,694 | 2.5% |
| Nashville - TN | 15,737,908 | 287.8% |
| Memphis - TN | 12,748,681 | -10.7% |
Source: CoStar
Again, Site Selection Group focused on data variables that are near-real time for this blog. Any site selection decision should be supported with a wealth of information more than what was demonstrated here. Regardless, 2021 is shaping up to be every bit as dynamic as 2020.
