

by Kelley Rendziperis, on Apr 20, 2021 2:10:02 PM
September Update
As we near the end of the year and in anticipation of the 2021 economic incentive analysis, we wanted to repost our annual white paper. As summarized in our report, the number of announced economic incentive deals and corresponding incentive values has declined over the prior 5 years. However, with certain sectors of market activity busier than ever, it will be interesting to see if announced deals are on the rise; as well as, what programs may have been added, eliminated or changed.

Economic incentives continue to play a critical role in corporate location strategies. From tax credits to cash grants, companies are securing benefits in exchange for job creation and capital investment across the U.S.
State and local economic incentives have proven to be a valuable way to help companies offset their capital investment and reduce ongoing operating costs. The availability and type of economic incentives varies greatly across the U.S., which makes it difficult for companies to predict the impact of these benefits on their projects. In addition, the complexity of the economic incentive compliance management process has made it more challenging for companies to realize the value of economic incentives as issuing entities are requiring more accountability and reporting. To help you develop an economic incentive strategy, Site Selection Group summarizes economic incentive trends, as well as market conditions, by state in the 2021 Economic Incentives U.S. Market Report.
Economic Incentive Market Trends
While it seems as though economic incentives are increasingly publicized and in greater demand from the C-suite than ever before, the number of projects receiving benefits and the total value of those incentives has been on the decline. The following table compares this trend over the last five years:
Total Economic Incentives Awarded (2016-2020)
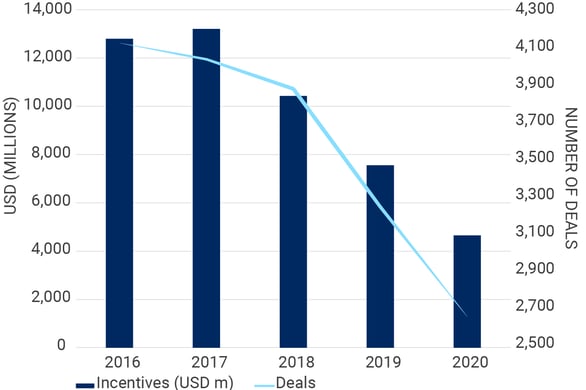
Source: IncentivesFlow, a Service from WAVTEQ Limited.
Economic Incentives by Project Type
The magnitude of economic incentives varies greatly by project type. Capital intensive projects such as manufacturing and infrastructure projects typically receive the greatest amount of economic incentives as they are heavily incentivized by property tax abatements and infrastructure grants. Conversely, employee intensive operations such as headquarters and business services are incentivized by tax credits, training subsidies and cash grants which are typically less valuable due to lower capital investment. The manufacturing sector led all industries in 2020 by garnering over $1.69 billion in economic incentive awards in exchange for an estimated $47.5 billion in capital investment and the commitment to create almost 114,000 jobs. Headquarter projects were the second largest project type with $1.02 billion in economic incentives.
Total Economic Incentives Awarded by Industry(2020)
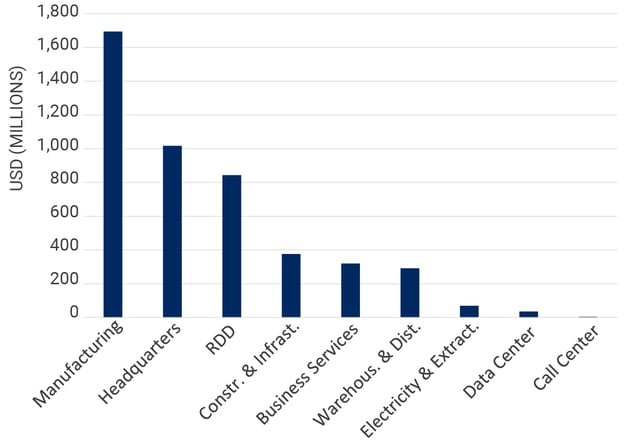 Source: IncentivesFlow, a Service from WAVTEQ Limited.
Conclusion
Although reported economic incentive awards have declined, companies and their stakeholders will continue to require these economic benefits to improve the overall return on investment of their projects. Meanwhile, the growing pressure from citizens for visibility into economic incentive awards will compel jurisdictions to be more selective in awarding incentives and more likely to adopt systematic and transparent policies and procedures.
To learn more about the most utilized economic incentive programs in the U.S., as well as notable 2020 projects and a comparison of economic incentive conditions by state, please review our 2021 Economic Incentives U.S. Market Report.
Please contact me at krendziperis@siteselectiongroup.com with any questions or for additional information.
