

by Kelley Rendziperis, on Oct 22, 2019 11:17:59 AM
To help understand economic incentive trends, this report evaluates economic incentive deals announced during the third quarter of 2019.
$1.56 billion in economic incentives
As of the date of publication, Site Selection Group identified 391 economic incentive packages offered to companies across the United States during the third quarter of 2019. These economic incentive packages represent an estimated total incentive value of approximately $1.56 billion. To garner these economic incentives, companies are expected to spend roughly $14.7 billion of capital and generate over 50,000 new jobs, resulting in:

When compared to the third quarter of 2018, Q3 2019 had a dip in the number of projects by roughly 20%, from 489 projects to 391 projects. The amount of the capital investment decreased by nearly 36%, and there was a slight decrease in the number of jobs. However, despite the decline in the number of projects, capital investment and the number of jobs, the actual total value of the incentives went up nearly 6%. This suggests that the economic incentive packages offered this quarter were larger, resulting in a slightly higher average award per job than those made during the same period last year.
The largest economic incentive this quarter was awarded to Cree Inc. by the state of New York to support the creation of a $1 billion, 480,000-square-foot silicon carbide chip factory. The incentive package includes a $501 million grant from Empire State Development, $1 million in tax credits through the Excelsior Jobs Program and equipment from the State University of New York. New York also had the largest incentive package in the first quarter of 2019 with its award of $300 million to IBM.
The 391 announced projects during the third quarter represented 37 states, led by Indiana with 45 announced projects and Ohio and Pennsylvania each with 33. New York and Florida offered the largest value of announced economic incentives with $532 million and $266 million, respectively. New York’s numbers are somewhat inflated by the $501 million incentive package offered to Cree; thus, excluding the Cree deal, Missouri offered the second largest value of announced projects at approximately $112 million.
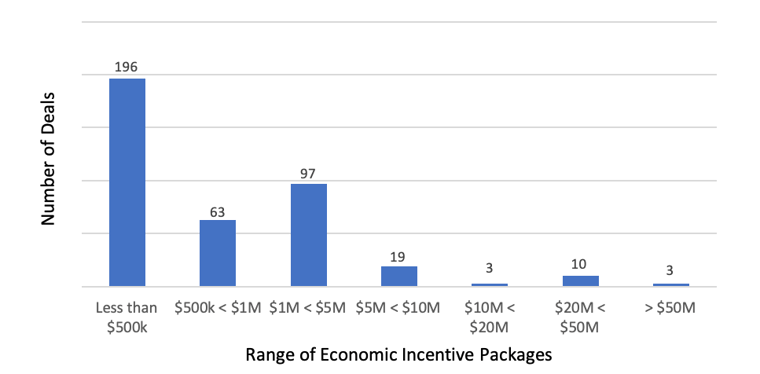
The following chart depicts the third quarter projects broken out by estimated incentive values:
Number of Projects by Incentive Value
 Data Source: IncentivesMonitor, a service from WAVTEQ Limited
Approximately 66%, or 259 of the 391 announced projects, were awarded economic incentive packages valued at $1 million or less and 91% were awarded economic incentive packages valued at $5 million or less. While the average economic incentive package was valued at approximately $3.98 million for all 391 announced projects, the average package for the top 25 deals was approximately $48.4 million.
Economic incentives and industry trends
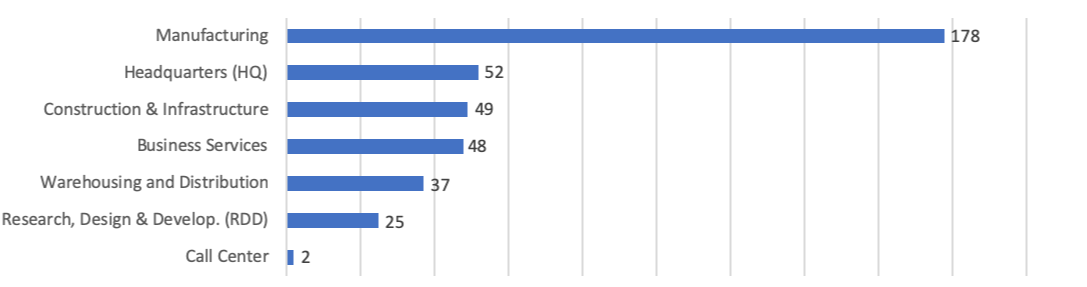
The following chart depicts the breakdown of the 391 announced projects during the third quarter of 2019 by industry sector:
Number of Projects by Industry Function in Q3 2019
Data Source: IncentivesMonitor, a service from WAVTEQ Limited
Economic incentive projects announced during the third quarter of 2019 represent a large amount of activity in the manufacturing industry function category with projects from Cree, Goodyear Tire, Xerox and many other companies reflected in the top 25 announced incentive projects. The headquarters category also had 52 announced projects during the quarter.
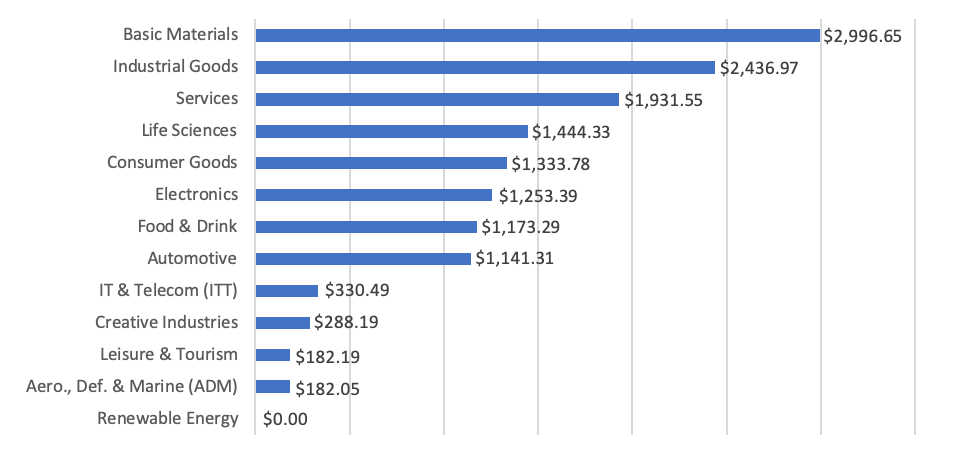
CapEx Value by Industry in Q3 2019 (USD m)
Source: IncentivesMonitor, a service from WAVTEQ Limited
The top performing Industries this quarter for total capital investment were the basic materials and industrial goods sectors, which together account for nearly 36% of all the investment made during this period. Services benefited from large high-profile projects including the Waddell & Reeds headquarters relocation, as well as 76 other services projects during the quarter.
The top 25 economic incentive packages announced in the third quarter represent approximately $1.21 billion of the total $1.56 billion of estimated incentives for all projects, approximately 78%. These projects in isolation will account for:
- $4.18 billion of capital investment
- 17,203 new jobs
- A return on investment of approximately 29%
- $70,337 average award per new job
20 of the largest economic incentive packages in the third quarter
The following table identifies some of the largest economic incentive deals (removing real estate development and film incentives) offered in Q3 2019. These projects provide a great way to benchmark what range of economic incentives exist for a variety of project types. However, it is important to understand the values are estimated and typically only reflective of state level incentives.
| Company | Location | Industry Function | Incentives Value (USD m) | Capex (USD m) | Jobs Created |
|---|---|---|---|---|---|
| Cree | NY | Manufacturing | 501 | 1,000 | 600 |
| Waddell & Reed | MO | Headquarters | 62 | 90 | 1,039 |
| Bayer | MO | Headquarters | 45 | 164 | 500 |
| Uber Technologies | TX | Headquarters | 35.95 | 75 | 3,000 |
| Goodyear Tire & Rubber | NC | Manufacturing | 30 | 180 | 0 |
| Fidelity National Info. Serv. | FL | Headquarters | 29.9 | 145 | 500 |
| Graphic Packaging Holding | MI | Manufacturing | 28.34 | 600 | 0 |
| Aisin Seiki Co | TX | Manufacturing | 27.2 | 400 | 900 |
| Project Charlie Brown | CO | Manufacturing | 24.8 | 150 | 1,000 |
| Xerox Corporation | NC | Manufacturing | 16.43 | 18 | 600 |
| Atlas Air Worldwide Holdings | KY | Headquarters | 15 | 34 | 593 |
| eHealthInsurance | IN | Headquarters | 11.5 | 10 | 500 |
| CytRx | WY | Manufacturing | 9.3 | 18 | 100 |
| Robinhood | CO | Business Services | 9 | 0 | 800 |
| El Toro | KY | Headquarters | 7.5 | 11 | 400 |
| Amazon | OH | Warehousing & Dist. | 7.14 | 200 | 1,500 |
| Acrisure Holdings | MI | Headquarters | 7 | 33 | 400 |
| Berkshire Hathaway | IN | Manufacturing | 7 | 15 | 650 |
| PolicyGenius | NC | Headquarters | 6.67 | 6 | 377 |
| Sub-Zero Group | WI | Research, Design & Dev | 6.5 | 70 | 100 |
Data Source: IncentivesMonitor, a service from WAVTEQ Limited
Similar to the overall industry trends for all announced deals in the third quarter, 85% of the top 20 largest deals of this quarter were either headquarter or manufacturing projects.
The project creating the largest number of jobs in the list above is Uber, which announced that it plans to open a U.S. general and administrative hub to house various corporate functions in Dallas and create 3,000 jobs paying an average annual wage of $100,000.
Notable awards in the business services industry during the third quarter
Most projects are not nearly as sizable in terms of incentives offered as the top 20 highlighted above. Thus, we like to share notable Q3 projects garnering economic incentives in the business services and call center industries:
| Company | Location | Industry Function | Incentives Value (USD m) | Capex (USD m) | Jobs Created |
|---|---|---|---|---|---|
| Advent International | OH | Business Serv. | 3.5 | 4 | 550 |
| Brex | UT | Business Serv. | 2.74 | 0 | 1,000 |
| Selflessly | IN | Business Serv. | 1.75 | 0.97 | 110 |
| Woven Teams | IN | Business Serv. | 1.75 | 0.61 | 122 |
| Healthx | IN | Business Serv. | 1.7 | 6.85 | 80 |
| KSM Consulting | IN | Business Serv. | 1.55 | 1.2 | 100 |
| Qualifi Technologies | IN | Business Serv. | 1.5 | 1.52 | 96 |
| ALJ Regional Holdings | KY | Call Center | 1.5 | 12.2 | 450 |
| Cubic Corporation | NY | Call Center | 0.3 | 1.6 | 200 |
Data Source: IncentivesMonitor, a service from WAVTEQ Limited
The five projects above from Indiana were all recipients of the Indiana Economic Development for a Growing Economy (EDGE) credit. This is an incentive the state uses to support job creation, capital investment and to improve the standard of living for its residents. It is a refundable corporate income tax credit that is calculated as a percentage of the expected increased tax withholdings generated from new job creation.
Similar to many of the other industry sectors, announced projects in the business services industry function saw a decrease in the number of projects going from 116 in the second quarter of 2019 to 48 deals this quarter.
Conclusion
We continue to routinely monitor announced projects to help companies estimate the level and type of economic incentives which may be applicable to future projects.
Please note that the analysis above is based on publicly available data at the time of this article. In addition, the current quarter’s data is compared to the information available at the time of prior quarterly articles.
For additional information about these projects and others, please contact me at krendziperis@siteselectiongroup.com for any questions.
