

by Kelley Rendziperis, on Jul 23, 2019 1:28:42 PM
Economic incentives continue to be a critical factor considered during the site selection process as companies evaluate locations for expansion. State and local economic development organizations utilize these economic incentives to attract and retain companies. These incentives will typically include tax abatements, tax credits, training grants, cash grants, utility rebates and a variety of other economic development tools to help offset capital and operating costs. To help understand economic incentive trends, this report evaluates economic incentive deals announced during the second quarter of 2019.
$1.26 billion in economic incentives
As of the date of publication, Site Selection Group identified 610 economic incentive packages offered to companies across the United States during Q2 2019. These economic incentive packages represent an estimated total incentive value of approximately $1.26 billion. To garner these economic incentives, companies are expected to spend approximately $18.52 billion of capital and generate over 67,600 new jobs with the following results:
- A total return on investment of approximately 6.8%
- An average economic incentive award of $18,557 per new job
- An average incentive award of approximately $2.06 million per project
- A median economic incentive award of approximately $310,000
When compared to the second quarter of 2018, this period offered slightly less in terms of total incentive value, with $1.26 billion versus $1.9 billion from the year-ago quarter. However, with an overall value of capital investment of $18.52 billion, the Q2 2019 still was significantly larger than the $15.5 billion that companies invested during the same period a year ago, showing that while there were less economic incentives awarded, actual investment does not appear to be slowing down.
The largest economic incentive this quarter was awarded to Fiat Chrysler Automobiles by the state of Michigan to support the $1.6 billion conversion project of an existing industrial complex into the future assembly site for the next-generation Jeep Grand Cherokee and an all-new Jeep SUV. The $195.5 million award will be distributed through various state and local programs. The project is expected to create 3,850 new jobs at an average annual wage of $59,846 per employee. The automaker also expects to create 1,100 new jobs at the Jefferson North Assembly Plant.
The 610 announced projects represented 39 states, led by Pennsylvania with 120 deals followed by California with 70. Pennsylvania held the top position for both quarters of 2019. Michigan and California offered the largest value of economic incentives with $273.57 million and $206.59 million, respectively. The vast bulk of Michigan’s incentives can be accounted for by the previously mentioned $195.5 million incentive for Fiat Chrysler.
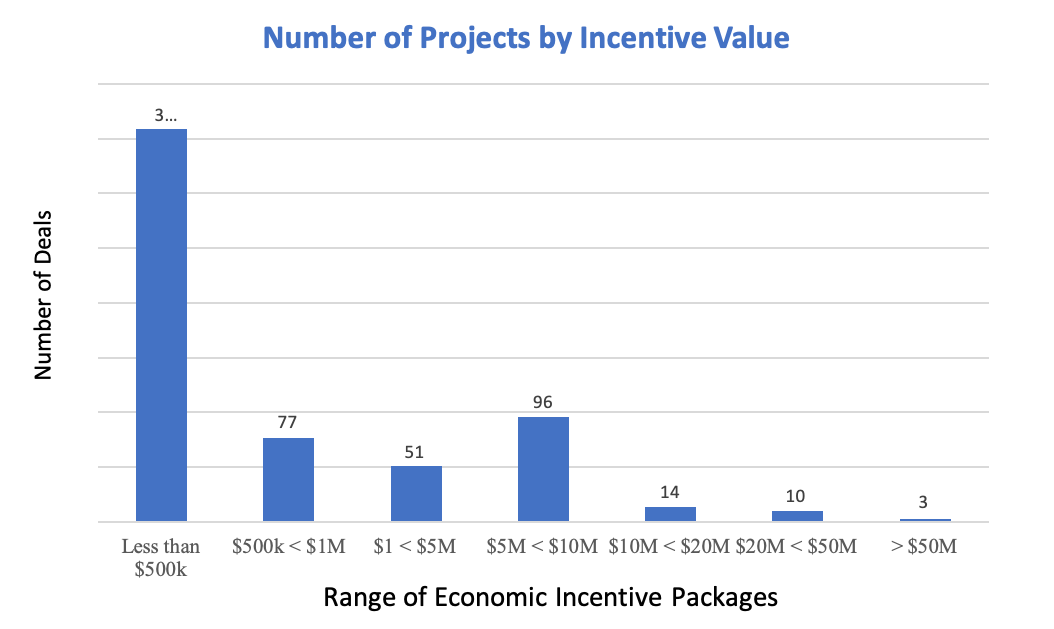
The following chart depicts the 610 projects broken out by estimated incentive value:
 Data Source: IncentivesMonitor, a service from WAVTEQ Limited.
Approximately 71.5%, or 436 of the 650 announced projects, were awarded economic incentive packages valued at $1 million or less and 79.8% were awarded economic incentive packages valued at $5 million or less. While the average economic incentive package was valued at approximately $2.06 million for all 610 announced projects, the average economic incentive package for the top 25 deals was approximately $28.56 million.
The top 25 economic incentive packages announced in the second quarter represent approximately $714.03 million of the total $1.26 billion of estimated incentives for all projects, almost 56.8%. These projects, in isolation, will account for the following:
- $10.1 billion of capital investment
- 20,487 new jobs
- A return on investment of approximately 7.1%
- $34,853 average award per new job.
20 of the largest economic incentive packages in the second quarter
The following table identifies some of the largest economic incentive deals (removing real estate development and film incentives) offered in the second quarter of 2019. These projects provide a great way to benchmark what range of economic incentives exist for a variety of project types. However, it is important to understand the values are estimated and typically only reflective of state level incentives.
| Company | Location | Industry function | Incentives Value (USD m) | Capex (USD m) | Jobs Created |
|---|---|---|---|---|---|
| Fiat Chrysler Automobiles | Michigan | Manufacturing | 195.50 | 2,500 | 4,950 |
| Lowe's | North Carolina | IT Support Center | 56.09 | 153 | 1,600 |
| General Motors (GM) | Missouri | Manufacturing | 50.00 | 750 | 0 |
| ON Semiconductor | New York | Manufacturing | 40.00 | 720 | 150 |
| Cellco Partnership (Verizon Communications) | New York | Data Center | 28.90 | 241 | 10 |
| Fiat Chrysler Automobiles | Michigan | Manufacturing | 27.87 | 2,024 | 1,483 |
| European Holding Co. | Arkansas | Headquarters (HQ) | 24.00 | 90 | 565 |
| CIT Group | New Jersey | Business Services | 22.16 | 44 | 137 |
| Toyota Motor | Alabama | Manufacturing | 20.59 | 55 | 414 |
| Edwards Lifesciences Corp. | California | Manufacturing | 20.00 | 239 | 487 |
| Samsara Networks | California | Manufacturing | 20.00 | 190 | 2,098 |
| Volvo Group | Virginia | Manufacturing | 16.50 | 400 | 777 |
| FN Logistics | California | Warehousing and Distribution | 13.00 | 114 | 3,039 |
| Genmab | New Jersey | Headquarters (HQ) | 12.81 | 21 | 150 |
| Chemical Financial Corp. | Michigan | Headquarters (HQ) | 12.70 | 104 | 325 |
| Comcast Corp. | New Mexico | Research, Design & Development (RDD) | 10.70 | 505 | 330 |
| Haas Automation | Nevada | Manufacturing | 10.50 | 327 | 500 |
| Toyota Motor | Texas | Manufacturing | 10.32 | 392 | 0 |
| SmileDirectClub | Tennessee | Headquarters (HQ) | 10.05 | 217 | 2,010 |
Data Source: IncentivesMonitor, a service from WAVTEQ Limited.
Manufacturing dominated this quarter with the highest number of projects and capital investment, with automotive manufacturing taking the spotlight. Fiat was awarded more from a single incentive than the next three combined, although this trend was observed in the previous quarter with the award to IBM of $300 million. The largest difference between the two periods has been in the number of new jobs, with the second quarter of 2019 eclipsing the previous quarter by nearly 25,000 positions. Looking at Q2 2018, we can observe that there has been a shift toward higher levels of capital investment and lower overall incentive values over the previous year. The change in the number of jobs has more or less been consistent with 2018’s trends.
There were four headquarters projects in the top 25, including CZ-USA, SmileDirectClub, Genmab US and Chemical Bank. Despite having the lowest incentive of the four, SmileDirectClub took the lead in investment of $217 million and creation of 2,010 new jobs. The company plans to expand its headquarters in Nashville and manufacturing plant in Antioch, Tennessee.
Notable awards in the business services industry during the second quarter
Most projects are not nearly as sizable in terms of incentives offered as the aforementioned companies highlighted above. Still, there were some notable second-quarter projects garnering economic incentives in the business services industry:
| Company | Location | Industry Function | Incentives Value (USD m) | Capex (USD m) | Jobs Created |
|---|---|---|---|---|---|
| PharmaCord | Indiana | Call Center | 9.05 | 52 | 850 |
| Senture | Kentucky | Call Center | 1.50 | 2 | 270 |
| TLK Group | North Carolina | Call Center | 0.35 | 0 | 325 |
| Zipdrug | New Jersey | Business Services | 6.3 | 1.05 | 84 |
| The Allstate Corp. | Texas | Business Services | 5.4 | 11.00 | 1,300 |
| Ancestry.com Holdings | California | Business Services | 5 | 3.00 | 281 |
| AqGen Liberty Holdings | California | Business Services | 2.75 | 19.08 | 210 |
| Cigna Corp. | Connecticut | Business Services | 2.7 | 90.00 | 0 |
| BCforward | Indiana | Business Services | 2.6 | 1.00 | 300 |
| MetaCX | Indiana | Business Services | 2.55 | 1.40 | 75 |
| Ancestry.com Holdings | Utah | Business Services | 2.4 | 10.50 | 506 |
| Sovereign Lending Group | California | Business Services | 1.74 | 1.36 | 474 |
| Infobip | New Jersey | Business Services | 1.44 | 0.61 | 25 |
Data Source: IncentivesMonitor, a service from WAVTEQ Limited.
Economic incentives and industry trends
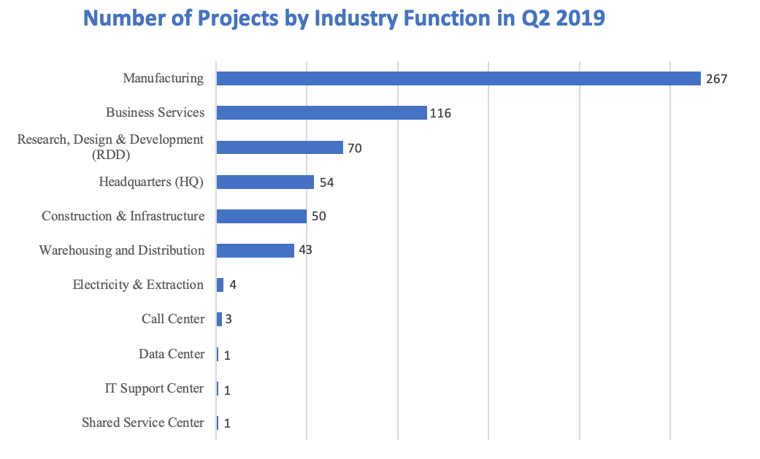
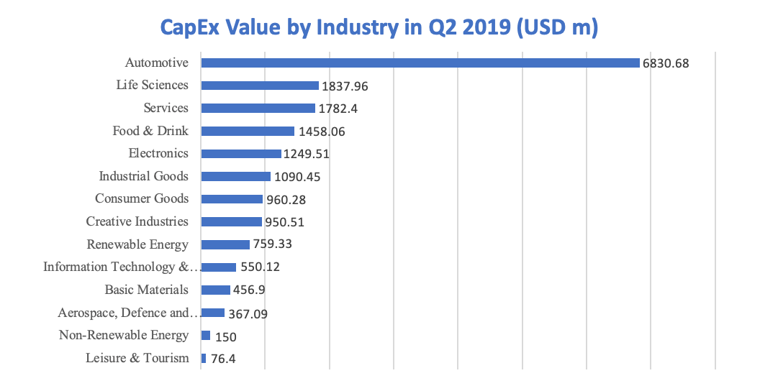
The following chart depicts the breakdown of the 610 announced projects during the second quarter of 2019 by industry sector:
Data Source: IncentivesMonitor, a service from WAVTEQ Limited.
Economic incentive awards announced in the second quarter of 2019 represent a large amount of activity in the automotive manufacturing industry with projects from Fiat Chrysler, General Motors, Toyota and Volvo, all of which held one or two different projects in the top 20 economic incentives. In fact, over a quarter of the largest incentives of Q2 went to these manufacturers. More generally, even though they made up roughly 5% of all of the total project count, automotive manufacturers constituted almost 37% of the projected capital expenditures. Industries like this will likely continue this trend in the short-term, as the cost of automation and capital investment become relatively more affordable as the tightening of the production workforce and unemployment rate drive up labor costs.
We continue to routinely monitor announced projects to help companies estimate the level and type of economic incentives which may be applicable to future projects.
 Source: IncentivesMonitor, a service from WAVTEQ Limited.
Please note that the analysis above is based on publicly available data at the time of this article. In addition, the current quarter’s data is compared to the information available at the time of prior quarterly articles.
For additional information about these projects and others, please contact me at krendziperis@siteselectiongroup.com for any questions.
