

by Kelley Rendziperis, on Jun 6, 2023 8:00:00 AM
In the ever-evolving landscape of economic development, economic incentives play a pivotal role in shaping corporate site selection decisions, regional growth and the overall economy. These economic incentives serve as catalysts, helping companies to expand, invest and establish their roots in specific locations, creating jobs, fostering innovation and generating tax revenue. To help evaluate the economic incentive climate, Site Selection Group identified 316 economic incentive packages offered to companies across the United States during the first quarter of 2023.
$7.1 billion in economic incentives
These economic incentive packages represent an estimated total incentive value of approximately $7.1 billion. To garner these economic incentives, companies are expected to spend roughly $71.5 billion of capital investment and generate close to 51,600 new jobs, resulting in:
- A total return on investment of approximately 9.9%
- An average economic incentive award of $137,475 per new job
- An average incentive award of approximately $22.4 million per project, which is heavily skewed by mega projects
- A median economic incentive award of approximately $480,000
Economic incentive awards continue to increase with $7.1 billion reflecting the most announced incentives for a quarter since Site Selection Group started tracking deals on a quarterly basis. When compared to the first quarter of 2022, Q1 2023 had a 42% increase in the total value of announced economic incentive awards and an 85% increase in the average award per job despite a decrease in the number of projects by roughly 9%, from 346 to 316 projects. Capital investment increased by 66.8% while the number of jobs decreased by 23.2% from this time last year.
The largest announced economic incentive award this quarter was offered to Redwood Materials to expand its battery recycling and materials facility in McCarran, Nevada. Redwood Materials was awarded a $2 billion loan through the Advanced Technology Vehicles Manufacturing Loan Program. The performance-based incentive is contingent on the company meeting capital investment targets and creating 1,600 new jobs.
The 316 announced projects during the first quarter represented 35 states led by Ohio with 57 and Kentucky with 42 announced projects, or 53 and 30, respectively, excluding film and real estate projects. Michigan and Nevada offered the largest announced economic incentive awards totaling $2.42 billion and $2.33 billion, respectively.
The most notable project from Michigan is Ford Motor Company’s $3.5 billion investment to construct and equip a new 2.5 million-square-foot lithium iron phosphate electric vehicle battery manufacturing facility. The deal is expected to create 2,500 new jobs paying an average annual wage of $61,495 in Marshall, Michigan. Ford Motor was awarded $630 million in road, infrastructure and site development incentives, $772 million in tax credits over a 15-year period through the Michigan Strategic Neighborhood Fund, a $120.3 million grant through the Michigan Strategic Site Readiness Program, a $210 million grant through the Michigan Critical Industry Program and $36 million through the Jobs for Michigan Investment Fund Loan Program, for a total package in excess of $1.76 billion and a return on investment exceeding 50%.
Top 10 States for Number of Announced Incentive Packages
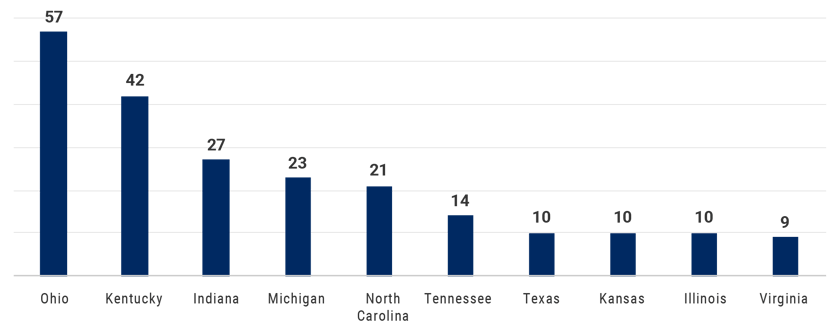 Source: IncentivesFlow, a service from WAVTEQ Limited
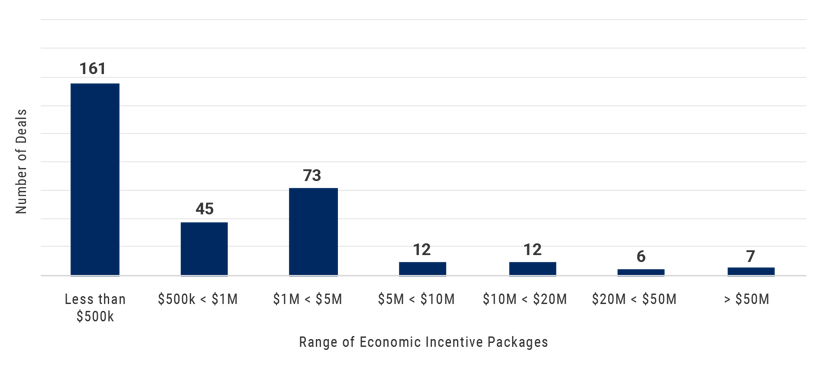
The following chart depicts the number of projects announced during the first quarter broken out by estimated economic incentive value:
 Source: IncentivesFlow, a service from WAVTEQ Limited
Economic incentives and industry trends
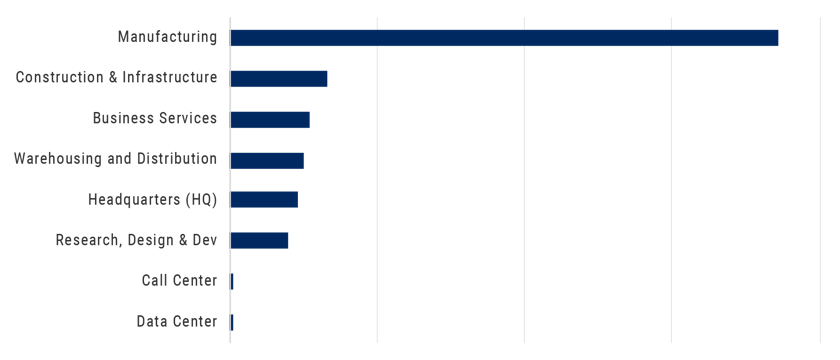
The following chart depicts the breakdown of the 316 announced projects during the first quarter of 2023 by industry function:
 Source: IncentivesFlow, a service from WAVTEQ Limited
Manufacturing continues to be the top incentivized industry function this quarter. The sector was led by Redwood Materials, Ford Motor Company, Volkswagen, Tesla and Integra Technologies.
The chart below illustrates the level of capital investment committed by industry sector this quarter:
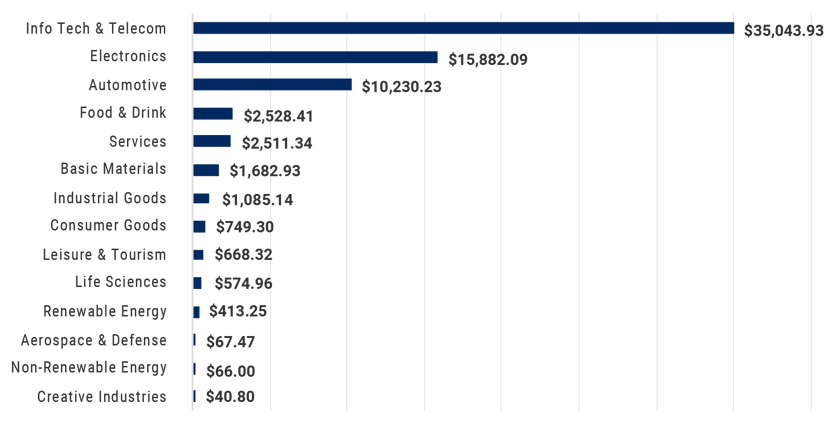
Source: IncentivesFlow, a service from WAVTEQ Limited
The top industry sectors in terms of projected capital investment were the Electronics and Automotive sectors, which together account for nearly 71% of all the investments announced during this period.
Notable economic incentive packages in the first quarter
The top 25 economic incentive packages announced in the first quarter represent approximately $6.16 billion of the total $7.1 billion of estimated incentives for all projects, or approximately 86.8%. These projects in isolation will account for the following:
- $62 billion of capital investment
- 28,714 new jobs
- A return on investment of approximately 9.9%
- An average award per new job of $232,825
The following table identifies some of the largest economic incentive deals, excluding real estate development and film incentives, offered in Q1 2023. These projects provide a great way to benchmark the potential range of economic incentives for a variety of project types. However, it is important to understand these values are estimated and typically only reflect state-level incentives.
Company |
Location |
Industry Function |
Incentives Value (USD M) |
CapEx
|
Jobs Created |
|
Redwood Materials
|
McCarran, NV | Manufacturing | $2,000.0 | $0 |
1,600
|
| Ford Motor Company | Marshall, MI | Manufacturing | $1,768.3 | $3,500 |
2,500
|
| Volkswagen | Blythewood, SC | Manufacturing | $1,291.0 | $2,000 |
4,000
|
| Tesla | Storey County, NV | Manufacturing | $330.0 | $3,600 |
3,000
|
| Integra Technologies | Bel Aire, KS | Manufacturing | $305.0 | $1,800 |
2,000
|
| Amazon | Multiple Locations, VA | Data Center | $140.0 | $35,000 |
1,000
|
| Microchip Technology | Colorado Springs, CO | Manufacturing | $47.0 | $880 |
418
|
| AgTech OS | Pullman, WA | Manufacturing | $37.5 | $1 |
44
|
| Texas Instruments | Lehi, UT | Manufacturing | $33.4 | $11,000 | 800 |
| Northwestern Mutual | Milwaukee, WI | Business Services | $30.0 | $500 |
3,750
|
| Plenty Unlimited | Laramie, WY | Research, Design & Development | $20.0 | $0 |
125
|
| Orgill | Collierville, TN | Headquarters (HQ) | $17.0 | $77 |
65
|
| Toyota Industries | Noblesville, IN | Headquarters (HQ) | $13.4 | $130 |
250
|
| Comcast Corporation | Frisco, TX | Construction & Infrastructure | $12.7 | $550 |
0
|
| Urban Outfitters | Raymore, MO | Warehousing & Distribution | $12.3 | $60 |
750
|
| Nestle | Anderson, IN | Manufacturing | $12.0 | $460 |
68
|
| Kaseya | Miami, FL | Headquarters (HQ) | $11.7 | $16 |
3,400
|
| NHanced Semiconductors | Odon, IN | Manufacturing | $11.0 | $236 |
413
|
| Saint-Gobain | Bryan, TX | Manufacturing | $10.9 | $140 |
130
|
| Procter & Gamble | Corinne, UT | Manufacturing | $10.4 | $400 |
100
|
Notable awards in the business services industry during the first quarter
Most projects are not nearly as sizable in terms of incentives offered as the 20 highlighted above. Thus, we like to share notable Q1 projects garnering economic incentives in the business services and call center industries:
Company |
Location |
Industry Function |
Incentives Value (USD M) |
CapEx
|
Jobs Created |
|
NexTec Group
|
Birmingham, AL | Business Services | $2.0 | $0.0 | 311 |
| Soladoc (Greenlight.guru) | Indianapolis, IN | Business Services | $2.0 | $3.2 | 103 |
| Delineate | Fishers, IN | Business Services | $1.2 | $0.0 | 49 |
| BMW | Columbus, OH | Business Services | $1.0 | $0.0 | 760 |
| Discover Financial Services | Whitehall, OH | Call Center | $0.4 | $16.0 | 20 |
Conclusion
While the metrics of Q1 2023 reflect approximately $7 billion of economic incentives awarded in exchange for $71.5 billion of capital investment and 51,500 jobs, the vast majority is driven by the continuing mega project trend. Large-scale projects with massive economic incentive awards tend to skew the overall metrics. When we review more normalized projects, we find that most projects are garnering smaller economic incentive awards in comparison to prior quarters. It is likely this trend will continue throughout the year as we continue to see large capital-intensive projects locating to the United States driven by the Inflation Reduction Act, such as the solar industry.
Please note that the analysis above is based on publicly available data at the time of this blog. In addition, the current quarter’s data is compared to the information available at the time of prior quarterly blogs.
For additional information about these projects and others, please contact me at krendziperis@siteselectiongroup.com with any questions.
Contributions by Matthew Kahn.
