

by Kelley Rendziperis, on Apr 23, 2019 3:26:27 PM
To help understand economic incentive trends, this report evaluates economic incentive deals announced during the first quarter of 2019.
$1.19 billion in economic incentives
As of the date of publication, Site Selection Group identified 451 economic incentive packages offered to companies across the United States during the first quarter of 2019. These economic incentive packages represent an estimated total incentive value of approximately $1.19 billion. To garner these economic incentives, companies are expected to spend approximately $15.8 billion of capital and generate over 43,500 new jobs, resulting in:
- a total return on investment of approximately 7.6%;
- an average economic incentive award of $27,410 per new job;
- an average incentive award of approximately $2.6 million per project; and
- a median economic incentive award of approximately $350,000.
When compared to the first quarter of 2018, this period offered slightly less in terms of total incentive value, with $1.19 billion versus $1.49 billion from the year-ago quarter. However, with an overall value of capital investment of $15.8 billion, the first quarter of 2019 almost doubles the $8.9 billion that companies invested during the same period a year ago, showing that while there were less economic incentives awarded, actual investment does not appear to be slowing down.
The largest economic incentive this quarter was awarded to IBM by the state of New York to support the creation of a $2 billion Artificial Intelligence Hardware Center for advanced computer chip research. The $300 million grant will be distributed over a five-year period through the Empire State Development Corp. to create 326 new jobs and retain 630 employees.
The 451 announced projects represented 40 states, led by Pennsylvania with 57 deals and Massachusetts with 43. New York and Texas offered the largest value of economic incentives with $417.7 million and $89.9 million, respectively. The vast bulk of New York’s $417.7 million of incentives can be accounted for by the IBM incentive of $300 million, but even without this project, New York would still be leader for this quarter at nearly $118 million of other incentives.
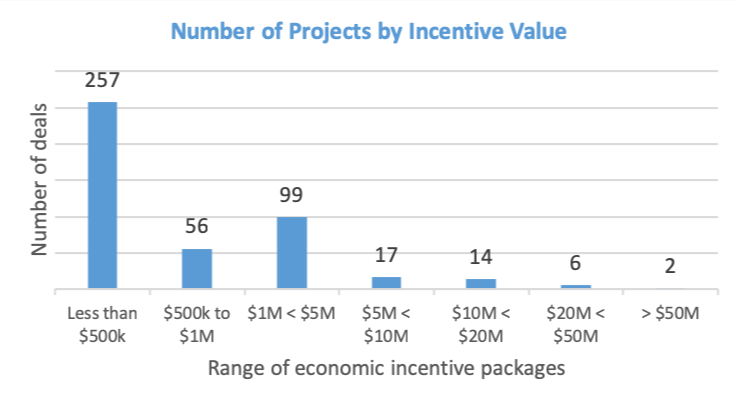
The following chart depicts the 451 projects broken out by estimated incentive values:
 Data Source: IncentivesMonitor, a service from WAVTEQ Limited.
Approximately 69.4%, or 313 of the 451 announced projects, were awarded economic incentive packages valued at $1 million or less and 91% were awarded economic incentive packages valued at $5 million or less. While the average economic incentive package was valued at approximately $2.6 million for all 451 announced projects, the average economic incentive package for the top 25 deals was approximately $32 million.
The top 25 economic incentive packages announced in the first quarter represent approximately $807 million of the total $1.19 billion of estimated incentives for all projects, almost 68%. These projects in isolation will account for:
- $7.9 billion of capital investment;
- 9,311 new jobs;
- a return on investment of approximately 10%; and
- $86,703 average award per new job.
20 of the largest economic incentive packages in the first quarter
The following table identifies some of the largest economic incentive deals (removing real estate development and film incentives) offered in the first quarter of 2019. These projects provide a great way to benchmark what range of economic incentives exist for a variety of project types. However, it is important to understand the values are estimated and typically only reflective of state level incentives.
| Company | Location | Industry function | Incentives Value (USD m) | Capex (USD m) | Jobs Created |
|---|---|---|---|---|---|
| IBM Corp. | NY | Research, Design & Devel. | 300.00 | 2,000 | 326 |
| Boeing | TX | Warehousing and Dist. | 73.00 | 0 | 100 |
| ReadiFuels-Iowa | IA | Manufacturing | 48.95 | 59 | 31 |
| Nucor | KY | Manufacturing | 40.00 | 1,350 | 400 |
| Tubacex Group | OK | Headquarters (HQ) | 34.00 | 40 | 140 |
| Fintecna | WI | Manufacturing | 31.00 | 0 | 400 |
| Checkr (Project Validate) | CO | Headquarters (HQ) | 27.80 | 0 | 1472 |
| Hilco Trading (Hilco Global) | IL | Construction & Infrastructure | 19.70 | 100 | 178 |
| Sammons Enterprises | IA | Headquarters (HQ) | 19.22 | 65 | 125 |
| SK Holdings | GA | Manufacturing | 18.75 | 1,670 | 2000 |
| Scheels All Sports | CO | Construction & Infrastructure | 16.20 | 84 | 400 |
| Great Lakes Cheese | OH | Headquarters (HQ) | 15.18 | 183 | 400 |
| Recruit Holdings | CT | Business Services | 15.00 | 66 | 500 |
| Alphabet | MN | Data Center | 14.00 | 600 | 50 |
| GenScript Corp. | NJ | Research, Design & Devel. | 13.00 | 0 | 305 |
| Corelle Brands Holdings | MS | Manufacturing | 10.75 | 28 | 400 |
| Alphabet | MI | Manufacturing | 8.03 | 14 | 400 |
| LiDestri Foods | NY | Manufacturing | 8.00 | 51 | 123 |
| Airbus | AL | Research, Design & Devel. | 8.00 | 210 | 432 |
| Niagara Bottling | TX | Manufacturing | 7.80 | 90 | 70 |
Data Source: IncentivesMonitor, a service from WAVTEQ Limited.
Each of the two largest announced economic incentive awards received over $70 million of estimated incentive value. As was previously discussed, the largest of all the announced awards went to IBM in the state of New York. The second largest package was awarded by Fort Worth and Dallas in the amount of $73 million to Boeing’s Aviall Services, consisting of personal property tax rebates to expand their local operations and retain over 1,000 workers.
Alphabet, the parent company of Google and other notable tech companies, had two of the top deals this quarter. Alphabet’s largest project was for a new data center for Jet Stream, a subsidiary company of Google, which is investing $600 million to construct a new 370,000 square foot facility in Minnesota. The second is for the construction of a new manufacturing facility for Waymo, an Alphabet company focused on autonomous vehicle production, in Michigan.
Notable awards in the business services industry during the third quarter
Most projects are not nearly as sizable in terms of incentives offered as the aforementioned companies highlighted above. Thus, we like to share notable first quarter projects garnering economic incentives in the business services industry:
| Company | Location | Industry Function | Incentives Value (USD m) | Capex (USD m) | Jobs Created |
|---|---|---|---|---|---|
| Recruit Holdings | CT | Business Serv. | 15.00 | 66 | 500 |
| ActiveCampaign | IN | Business Serv. | 6.20 | 10 | 200 |
| A&P Coat | MA | Business Serv. | 6.10 | 35 | 360 |
| Dupaco Comm. Credit Union | IA | Business Serv. | 6.08 | 38 | 40 |
| PuppySpot Group | NJ | Call Center | 4.00 | 2 | 60 |
| PenFed Credit Union | TX | Business Serv. | 3.62 | 48 | 571 |
| LHC Group | LA | Business Serv. | 3.50 | 46 | 500 |
| Project Guard | CO | Business Serv. | 3.10 | 0 | 100 |
| Quantum Health | OH | Business Serv. | 2.80 | 0 | 350 |
| RoundTower Technologies | OH | Business Serv. | 2.50 | 0 | 128 |
Data Source: IncentivesMonitor, a service from WAVTEQ Limited.
Economic incentives and industry trends
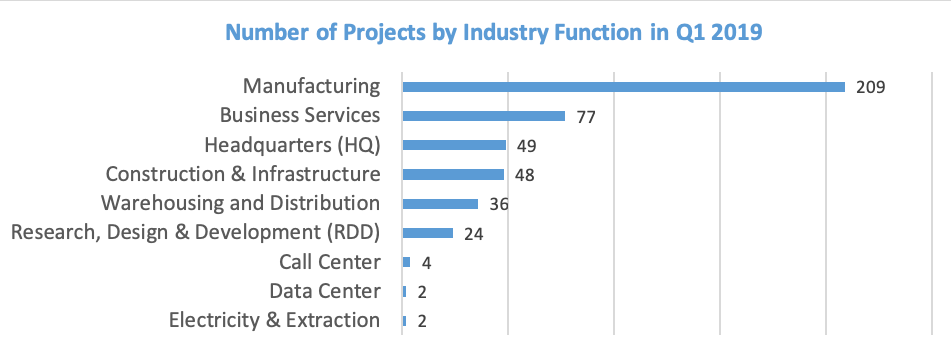
The following chart depicts the breakdown of the 451 announced projects during the first quarter of 2019 by industry sector:
 Data Source: IncentivesMonitor, a service from WAVTEQ Limited.
Economic incentive awards announced in the first quarter of 2019 represent a large amount of activity in the industrial goods manufacturing sector with projects from Nucor and the Tubacex Group, both reflected in the top 20 announced incentive projects. This quarter also reflects a larger volume in terms of announced projects, incentive values and capital investment. The difference between the first quarters of 2018 and 2019 is an increase from 38 announced deals valued at $44.5 million to 54 awards with a total value of $75.5 million. This quarter’s projects represent over $2 billion in capital investments, effectively doubling the previous year’s first quarter value, and more than twenty times the $86 million of investments made in the first quarter of 2017.
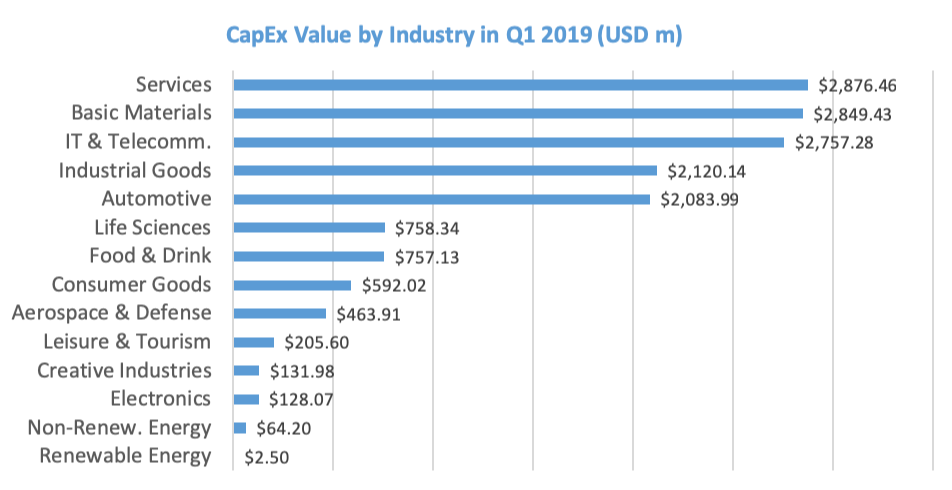
The information technology and telecommunications sector has also experienced growth since last year, with the number of announced deals growing from 30 in 2018 to 58 in 2019, with a total incentive value of over $400 million, almost five times greater than last year’s first quarter of $77 million of announced awards. The differences in capital investment is even more striking, with the total amounting to $2.76 billion in this quarter compared to the $77 million the previous year. Comparatively, the differences in job creations between these two periods is much closer, with 5,335 being created in the previous year’s first quarter and 7,080 from this period.
 We continue to routinely monitor announced projects to help companies estimate the level and type of economic incentives which may be applicable to future projects. Please note that the analysis above is based on publicly available data at the time of this article. In addition, the current quarter’s data is compared to the information available at the time of prior quarterly articles.
For additional information about these projects and others, please contact me at krendziperis@siteselectiongroup.com for any questions.
Source: IncentivesMonitor, a service from WAVTEQ Limited.
