by Josh Bays, on Aug 19, 2020 8:05:57 AM
Site Selection Group, a full-service location advisory, economic incentives and real estate services firm, utilizes several data-driven analyses to help its clients evaluate locations for manufacturing investment. One of the first steps a company should take to ensure operational success is to employ a top-down approach by starting with “everything” and then narrowing down which specific areas warrant an in-depth site selection review. This approach ensures that the company is not overlooking any candidate markets that could provide operational success.
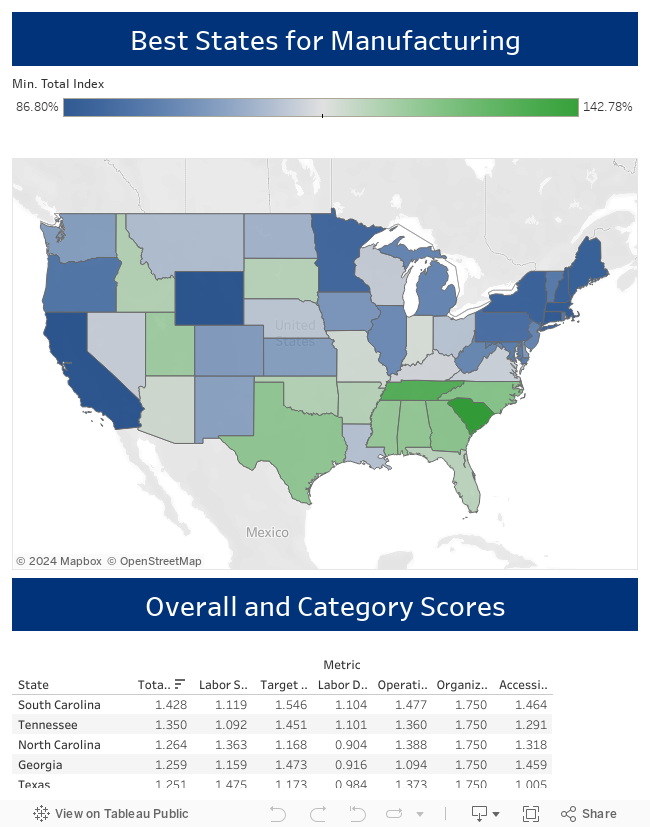
Ranking the most competitive states for manufacturing
As an annual demonstration of this type of inclusive approach, Site Selection Group uses its proprietary GeoCision® analysis to provide a ranking of all 50 states based on weighted site selection variables that measure primary considerations for manufacturers. These factors are not comprehensive, but they are representative of those typically utilized in industrial projects. For its corporate site selection projects, Site Selection Group almost always builds this type of analysis at the metro level to score and rank all 926 metropolitan and micropolitan statistical areas in a customized manner.
Although location criteria are unique to each specific project’s needs, there are standard site selection drivers that typically drive manufacturing location decisions. A company’s ability to hire and retain a qualified workforce, as well as its ability to receive and ship goods in a cost-effective and timely manner are typically the most influential factors that drive final site selection decisions. However, business environment, regulatory climate, utilities, infrastructure, real estate and economic incentives play an important role in the process. Since no location scores the best in each of these categories, the optimal location for a project is one that has no critical deficiencies. Those factors and weightings used for this exercise are shown in the table below.
| Category | Weighting | Summary |
|---|---|---|
| Labor Scalability | 5% | Measures the volume of workforce to ensure companies can scale their workforce |
| Target Skill Sets | 25% | Assesses industry and occupation presence to confirm the availability of targeted skill sets |
| Labor Demand | 20% | Analyzes the pressures other employers place on the employment market |
| Operating Costs | 30% | Quantifies the operating costs such as utilities, taxes, real estate, labor, etc. |
| Organized Labor | 10% | Assesses the threat posed by organized labor |
| Accessibility | 10% | Analyzes the population base with a one-day drive time of the site and distance to major ports |
Regions vary in competitiveness
Site Selection Group mapped and listed the results in the dashboard below. A score of 100% in any one category represents the national average. While no one state or region is a perfect fit for every project or specific industrial sector, there are a couple of clear trends. For starters, we see some of the “usual suspects” rise to the top – states that tend to rank well in manufacturing and business competitiveness rankings. Those include Southeastern states such as South Carolina, Tennessee, Georgia and Texas. In addition, many states show clear trade-offs between labor quality and cost, something companies will need to consider in their long-term strategy.
Differences from previous year
This list closely resembles that from 2019, but with a few notable changes. While the top states remain relatively constant, both South Carolina and Texas rank slightly higher on the list this year. Additionally, the overall pattern remains similar in both years. States in the southeast still tend to score more favorably than states in the west (i.e. California) or northeast.