

by Josh Bays, on Mar 24, 2020 3:26:59 PM
Note from the author: This research was conducted prior to the United States feeling its first meaningful impact of the coronavirus. It can be expected that the trends presented in this blog will be significantly disrupted in the near future.
One of the largest challenges companies have recently faced when expanding their distribution footprint is the lack of existing real estate product in favorable locations that have the capacity to support their project. Site Selection Group, a full-service location advisory, real estate and economic incentive services firm, monitors industrial activity in the United States.
National industrial vacancy rates have been steadily declining
Market rents nationally have grown steadily over the past 10 years but are starting to show signs of flattening. Meanwhile vacancy rates have historically tightened but have started trending upward over the last 18 months. The graph below displays these trends.
National Distribution Center Vacancy and Rental Rates
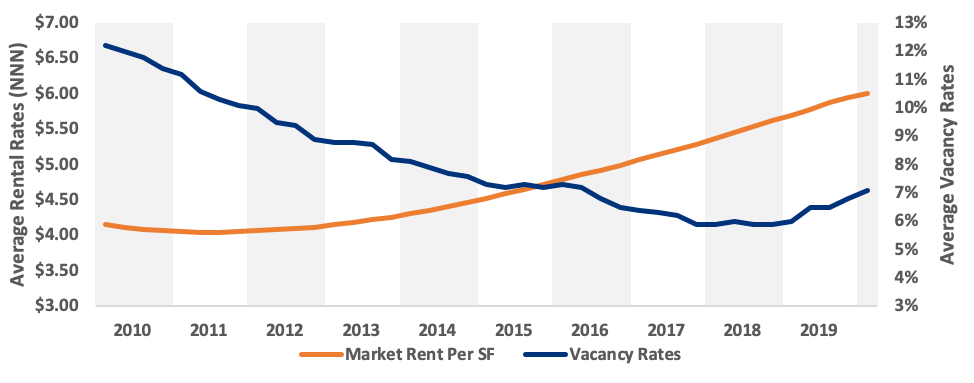
Source: CoStar
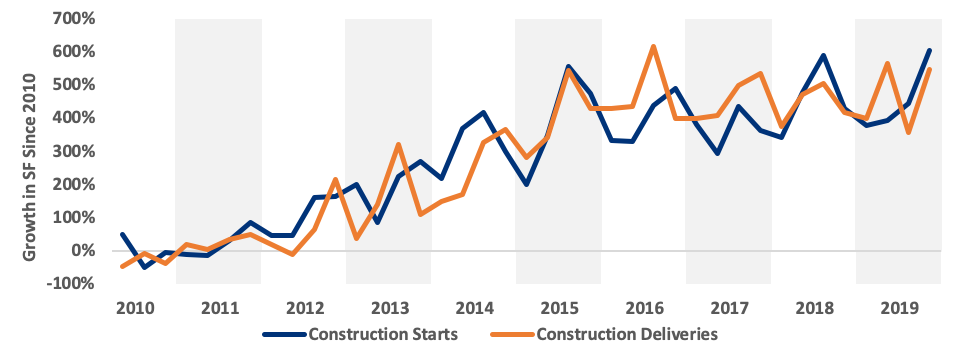
National construction starts and deliveries experience some volatility
The chart below shows the growth in national construction starts and deliveries by quarter since 2010. Growth has levelled off since 2015.
National Growth Trends in Distribution Center Real Estate
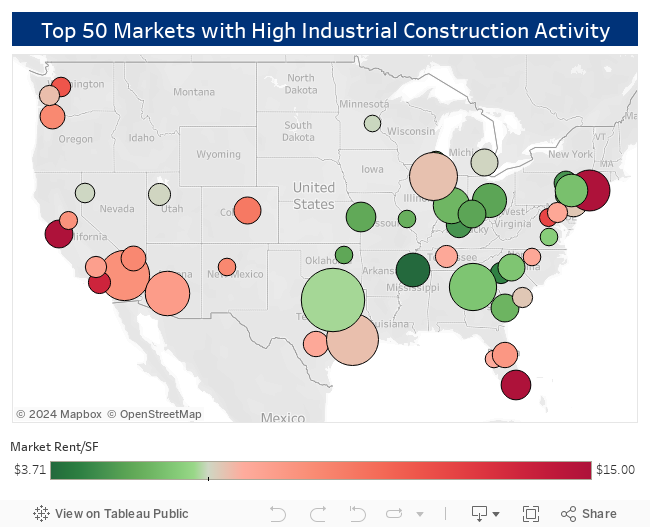
 Construction activity is still active in the large population centers
Construction activity seems to be correlated to high population centers to reduce delivery times to customers as the bulk of large industrial leases are e-commerce or retail fulfillment related. The following interactive map shows the 50 markets with the most industrial real estate under construction and is shaded by average rental rates.
20 Notable Distribution Leases So Far in 2020
The following chart shows 20 notable distribution leases in the United States in 2020. Unsurprisingly, eight of the most active industrial real estate markets appear on this list.
| Company Name | SF Occupied | Market |
|---|---|---|
| Ferrara Candy Co. | 1,600,000 | Chicago, IL |
| Amazon | 1,000,584 | Dallas, TX |
| Amazon | 798,000 | Richmond, VA |
| Mondelez International | 570,988 | Atlanta, GA |
| US Elogistics Service Corp. | 570,777 | New York, NY |
| SBS Transportation | 517,500 | Atlanta, GA |
| GE Appliances | 504,400 | Dalton, DA |
| Georgia Pacific Corp. | 495,625 | Altanta, GA |
| Amazon | 465,450 | Dallas, TX |
| Dollar General | 448,438 | Montgomery, AL |
| Amazon | 443,520 | Houston, TX |
| Eatery Essentials | 399,971 | Dallas, TX |
| Wholesome Sweeteners | 349,050 | Houston, TX |
| Bedabox LLC | 332,231 | Riverside, CA |
| Spectrum | 315,100 | St. Louis, MO |
| Lowe's Home Center | 285,547 | Las Vegas, NV |
| EL & EL Wood Products | 280,827 | Riverside, CA |
| Dukal Corp. | 269,950 | Savannah, GA |
| Bang Energy | 249,005 | Miami, FL |
| Amazon | 212,937 | Chicago, IL |
Source: Costar
