

by Josh Bays, on Apr 18, 2018 8:00:00 AM
Labor demand can tell potential employers many things about a market: competitive pressures, relative ease of hiring, and geographic trends, to name a few. In any site selection exercise, labor demand should be used in conjunction with other factors to verify that a skilled workforce is available. This is especially critical in high-headcount operations, such as manufacturing and production. In its engagements with corporate clients, Site Selection Group, a full-service location advisory, economic incentives and real estate services firm, utilizes various job postings data as a proxy for job demand.
Job postings as an indicator for pressure
Site Selection Group’s analysis utilizes two important facets of job postings. The first is unique postings, that is, postings for a single job opening rather than the total amount of postings overall. This considers the multiple avenues employers might use to source candidates. The amount of unique job postings by itself speaks to the amount of hiring activity within a market. The second important measure to consider is how many places and times an employer needs to advertise the same job. This indicator, referred to as posting intensity, gives a relative metric for how “hard” employers need to work to hire. A lower intensity implies a candidate was hired relatively quickly.
Metro areas with the highest growth in demand for production labor
Looking at unique postings isolated from other factors can be misleading, as larger markets will naturally have more postings. Therefore, Site Selection Group measured the growth in unique production postings from the past 12 months (March 2017-February 2018) compared to the preceding 12 months among top U.S. metro areas. The chart below displays those metros with the highest demand growth.
Top 20 Metro Areas for Production Growth
| Tulsa, OK | 33.26% |
| Houston-The Woodlands-Sugar Land, TX | 28.15% |
| Rochester, NY | 21.02% |
| Milwaukee-Waukesha-West Allis, WI | 20.24% |
| Madison, WI | 15.91% |
| Minneapolis-St. Paul-Bloomington, MN-WI | 13.05% |
| San Antonio-New Braunfels, TX | 12.60% |
| Pittsburgh, PA | 12.21% |
| Atlanta-Sandy Springs-Roswell, GA | 12.13% |
| Grand Rapids-Wyoming, MI | 11.22% |
| Akron, OH | 10.94% |
| St. Louis, MO-IL | 10.10% |
| Buffalo-Cheektowaga-Niagara Falls, NY | 9.26% |
| Charlotte-Concord-Gastonia, NC-SC | 8.02% |
| Columbus, OH | 7.54% |
| Greenville-Anderson-Mauldin, SC | 6.60% |
| Chicago-Naperville-Elgin, IL-IN-WI | 6.31% |
| Portland-Vancouver-Hillsboro, OR-WA | 5.90% |
| Providence-Warwick, RI-MA | 5.88% |
| Sacramento-Roseville-Arden-Arcade, CA | 5.70% |
Geographic trends in postings intensity
After identifying a market of interest, it can be very useful to further segment the market. For example, in mega-markets like Atlanta, a southern location within the market might be more or less attractive than a northern location. The interactive map below displays posting intensities for counties.
Posting Intensity by County
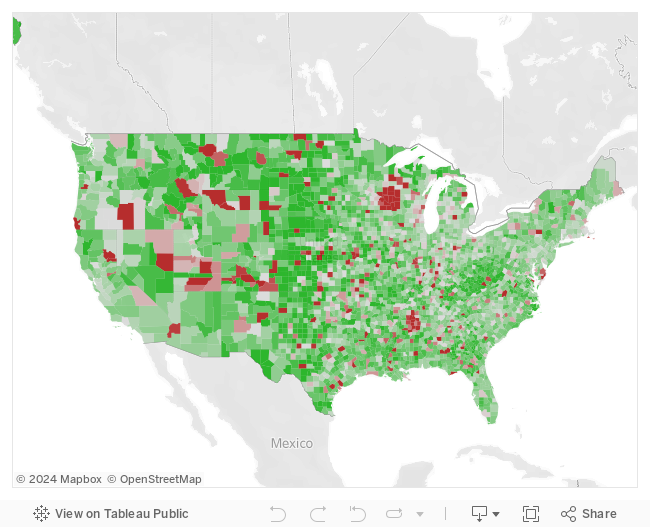
This data piece demonstrates the relative advantage of locating on the periphery of a larger market. As the map shows, there is generally less competition for production labor outside the center of a market. However, the significant advantage of access to a large labor pool still exists.
