

by Kelley Rendziperis, on Apr 23, 2024 2:00:00 PM
Ever since the passage of the Inflation Reduction Act (2022) there’s been a flurry of market activity to spur domestic manufacturing in sectors such as clean energy. Companies are working to maximize benefits provided by the IRA to improve their return on investment.
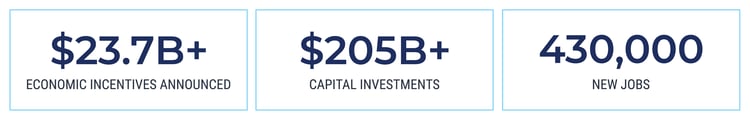
In addition to companies working to meet IRA deadlines, many achieved success over the past year in obtaining a wide variety of incentives. Overall, approximately $23.7 billion of economic incentives were awarded in 2023 across all industries and project types. Companies committed to investing over $205 billion and creating over 430,000 new jobs, resulting in an average return on investment of 11% and $54,900 per job.
To help develop an economic incentive strategy, Site Selection Group summarizes economic incentive trends, as well as market conditions, by state in this report. The information contained in this report is typically reflective of publicly available state-level awards and attempts to exclude federal incentives. All data used for the current year report and for prior year comparisons are reflective of data reported at the time of publication.

Economic Incentive Market Trends
In 2023, the number of reported economic incentive awards increased significantly from the prior year and was higher than the number of reported awards in 2018. The total value of economic incentives awarded of $23.7 billion was slightly less than in 2022, but still much higher than in recent years. The basis for the continued growth of the overall value of economic incentive awards continues to be tied primarily to renewable energy and other investments spurred by the IRA such as electric vehicles and/or electric vehicle battery manufacturing, semiconductor manufacturing, and steel manufacturing. Nearly half of the $23.7 billion of incentives announced in 2023 were derived from these types of projects. In addition, proof that the mega project trend continues, the six largest awards in 2023 accounted for $10.6 billion of incentives awards.
Total Economic Incentives Awarded
2018-2023
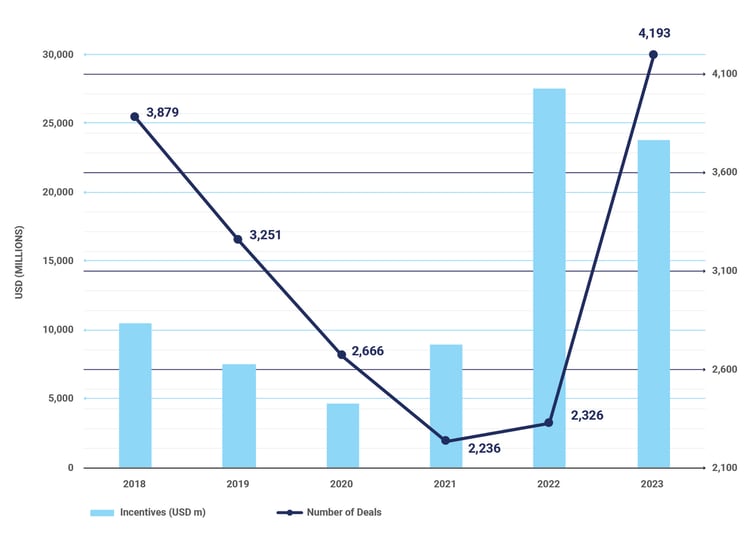
Source: IncentivesFlow, a Service from FDI Intelligence
Economic Incentives by Project Type
The magnitude of economic incentives varies greatly by project type. Capital-intensive projects such as manufacturing and infrastructure projects typically receive the greatest amount of economic incentives as property tax abatements and infrastructure grants heavily incentivize them. Conversely, employee-intensive operations such as headquarters and business services are primarily incentivized by tax credits, training subsidies and cash grants which are typically valued less overall due to lower capital investment. In 2023, a departure from prior years, the top 20 states reporting the largest cumulative economic incentive awards only accounted for 62% of all reported awards. This means we saw more states with higher cumulative awards.
Total Economic Incentives Awarded (2018-2023)
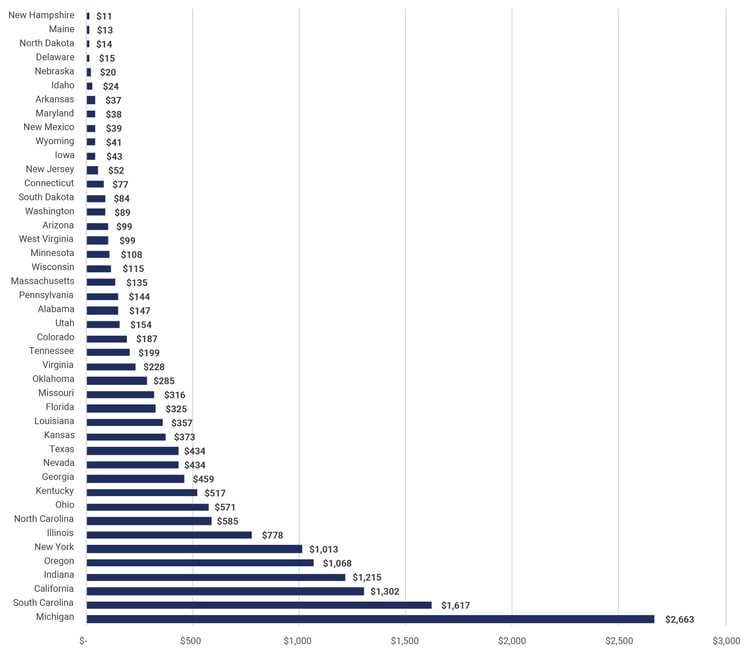
Source: IncentivesFlow, a Service from FDI Intelligence
Conclusion
As inflation continues to rise, supply chains remain challenged and megaprojects persist, the importance of state and local economic incentives in the site selection process cannot be diminished. To learn more about the most utilized U.S. economic incentive programs, including notable 2023 projects and a comparison of economic incentive conditions by state, please review our 2024 Economic Incentives U.S. Market Report.
