

by Kelley Rendziperis, on Sep 9, 2024 8:00:00 AM
In the ever-evolving landscape of economic development, economic incentives play a pivotal role in shaping corporate site selection decisions, regional growth and the overall economy. These economic incentives serve as catalysts, helping companies to expand, invest and establish their roots in specific locations, creating jobs, fostering innovation and generating tax revenue. To help evaluate the economic incentive climate, Site Selection Group identified 676 economic incentive packages offered to companies across the United States during the second quarter of 2024.
$16.4 billion in economic incentives
These economic incentive packages represent an estimated total incentive value of approximately $16.4 billion. To garner these economic incentives, companies are expected to spend roughly $125.2 billion of capital investment and generate close to 65,400 new jobs, resulting in:
- A total return on investment of approximately 13.1%
- An average economic incentive award of $251,429 per new job
- An average incentive award of approximately $24.3 million per project, which is heavily skewed by mega projects
- A median economic incentive award of approximately $750,000
Economic incentive awards continue to increase with $16.4 billion reflecting the most announced incentives for a quarter since Site Selection Group started tracking deals quarterly. When compared to the second quarter of 2023, Q2 2024 had a 160.3% increase in the total value of announced economic incentive awards and a 67.5% increase in the average award per job along with an increase in the number of projects by roughly 93.7%, from 349 to 676 projects. Capital investment increased by 225.9% and the number of jobs increased by 55.4% from this time last year.
This quarter's largest announced economic incentive award was offered to Taiwan Semiconductor Manufacturing Company, a leading semiconductor contract manufacturing and design firm. The company plans to invest $65 billion to build two new semiconductor fabrication facilities in Phoenix, Arizona. Additionally, it has committed to adding a third fab, with production of the world’s most advanced 2-nanometer technology expected to begin at the second Arizona fab in 2028. These facilities will manufacture chips for smartphones, autonomous vehicles and AI data center servers, and will create 6,000 new jobs.
The 676 announced projects during the second quarter represented 38 states led by Ohio with 59 and Louisiana with 31 announced projects. Arizona and Illinois offered the largest announced economic incentive awards totaling $11.6 billion and $855.03 million, respectively. The Taiwan Semiconductor Manufacturing Company project, approved for $6.6 billion in incentives and $5.5 billion in low-cost government loans from the U.S. Commerce Department, accounted for most of Arizona’s incentive offerings in the second quarter.
Top 10 States for Number of Announced Incentive Packages
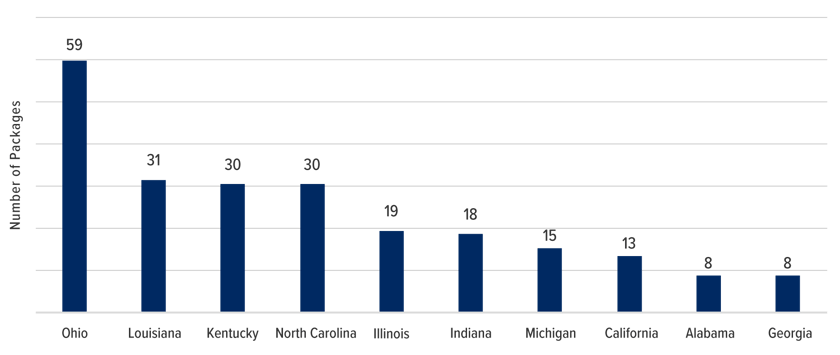
Source: IncentivesFlow, a Service from FDI Intelligence
The following chart depicts the number of projects announced during the second quarter broken out by estimated economic incentive value:

Even with significantly higher overall incentive packages awarded in Q2 2024, approximately 38%, or 256 of the 676 announced projects, were awarded economic incentives valued at $500,000 or less, and 89% were awarded economic incentive packages valued at $5 million or less. The top 25 deals, excluding film and real estate projects, accounted for over 92.7% of the total incentive awards. The top deal in isolation accounted for over 71% of the total incentives awarded.
Economic incentives and industry trends
The following chart depicts the breakdown of the 676 announced projects during the second quarter of 2024 by industry function:

Manufacturing continues to be the top incentivized industry function this quarter, led by Taiwan Semiconductor Manufacturing Company, Rivian, SK Group, Niagra Bottling and Highland Materials.
The chart below illustrates the level of capital investment committed by the industry sector this quarter:

The top industry sectors in terms of projected capital investment were the Electronics and Information Technology sectors, which together account for about 82% of all the investments announced during this period.
Notable economic incentive packages in the second quarter
The top 25 economic incentive packages announced in the second quarter represent approximately $15.2 billion of the total $16.4 billion of estimated incentives for all projects, or 92.7%. These projects in isolation will account for the following:
- $125.2 billion of capital investment
- 65,361 new jobs
- A return on investment of approximately 13.1%
- An average award per new job of $251,429
The following table identifies some of the largest economic incentive deals offered in Q2 2024, excluding awards solely with federal incentives, real estate development and film incentives. These projects provide a great way to benchmark the potential range of economic incentives for a variety of project types. However, it is important to understand these values are estimated and typically only reflect state-level incentives.
Company |
Location |
Industry Function |
Incentives Value (USD M) |
CapEx
|
Jobs Created |
| Taiwan Semiconductor Manu. Co. | Phoenix (AZ) | Manufacturing | $11,600.00 | $65,000.00 | 6,000 |
| Rivian | Normal (IL) | Manufacturing | $827.00 | $1,500.00 | 550 |
| SK Group | West Lafayette (IN) | Manufacturing | $686.70 | $3,870.00 | 800 |
| Niagara Bottling | Winter Haven (FL) | Manufacturing | $420.00 | $0.00 | 100 |
| Highland Materials | Surgoinsville (TN) | Manufacturing | $255.60 | $1,000.00 | 400 |
| Sanken Electric Co. | Bloomington (MN) | Manufacturing | $195.00 | $525.00 | 160 |
| Entegris | Colorado Springs (CO) | Manufacturing | $190.00 | $600.00 | 600 |
| Vemerald | Davenport (IA) | Data Center | $161.00 | $800.00 | 50 |
| Topsoe | Unspecified (VA) | Manufacturing | $136.00 | $400.00 | 150 |
| Applied Materials | Lynchburg (VA) | Manufacturing | $100.00 | $0.00 | 100 |
| Amazon | New Carlisle (IN) | Data Center | $98.30 | $11,000.00 | 1,000 |
| SKC | Covington (GA) | Manufacturing | $75.00 | $0.00 | 200 |
| Fujifilm | Holly Springs (NC) | RDD | $69.30 | $1,200.00 | 680 |
| Daisy Brand | Boone (IA) | Manufacturing | $67.20 | $626.50 | 55 |
| SolAero (Rocket Lab) | Albuquerque (NM) | Manufacturing | $49.40 | $70.00 | 100 |
| JSW Group | Mingo Junction (OH) | Manufacturing | $43.00 | $143.00 | 0 |
| Meta Platforms (Facebook) | Montgomery (AL) | Data Center | $42.00 | $800.00 | 100 |
| Toyota Motor | San Antonio (TX) | Manufacturing | $39.40 | $531.70 | 411 |
| Ingenia Chartam (Crossroads Paper) | Winnemucca (NV) | Manufacturing | $33.58 | $271.58 | 126 |
| PSGM3 (Pacific Steel Group) | San Diego (CA) | Manufacturing | $30.00 | $543.96 | 447 |
Notable awards in the business services industry during the second quarter
Most projects are not nearly as sizable in terms of incentives offered as the 20 highlighted above. Thus, we share notable Q2 projects garnering economic incentives in the business services and call center industries:
Company |
Location |
Industry Function |
Incentives Value (USD M) |
CapEx
|
Jobs Created |
| Leadership in Flight Training Academy | Tuskegee (AL) | Business Services | $5.26 | $27.00 | 35 |
| Communications Test Design (CTDI) | Charlestown (IN) | Business Services | $4.75 | $26.00 | 600 |
| Exyte | Boise (ID) | Business Services | $4.50 | $0.00 | 102 |
| Medar | Gilroy (CA) | Business Services | $3.79 | $0.00 | 40 |
| Macquarie Infrastructure Corp. | Chicago (IL) | Business Services | $3.40 | $53.50 | 700 |
| CModel Data | Birmingham (AL) | Business Services | $2.72 | $0.12 | 80 |
| JQOL | Louisville (KY) | Business Services | $2.00 | $6.48 | 113 |
| Cintas Corp. | Mason (OH) | Business Services | $2.00 | $10.00 | 125 |
Conclusion
While the metrics of Q2 2024 reflect approximately $16.4 billion of economic incentives awarded in exchange for $125.2 billion of capital investment and 65,361 jobs, the vast majority of incentive awards are driven by the continuing mega-project trend. Large-scale projects with massive economic incentive awards tend to skew the overall metrics. When reviewing more normalized projects, we find that most projects are garnering smaller economic incentive awards than in prior quarters. This trend will likely continue throughout the year as we see large capital-intensive projects driven to the United States by the Inflation Reduction Act, such as the semiconductor and electric vehicle sectors.
Please note that the analysis above is based on publicly available data at the time of this blog. In addition, the current quarter’s data is compared to the information available at the time of prior quarterly blogs.
Contributions by Matthew Kahn.
