

by King White, on Mar 23, 2021 2:34:17 PM
The long-term impact of the COVID-19 pandemic on specific industry sectors, labor markets, real estate and site selection continues to unwind as vaccines are rolling out across the U.S. The industrial and e-commerce sectors have been on fire, while office and traditional retail are very mixed. To help you identify what industries and metro areas have been impacted the least and greatest, Site Selection Group has evaluated unemployment trends to help you develop a site selection strategy for the future.
Historic unemployment trends show impact of COVID-19 black swan event
The economy was at full employment prior to COVID-19 which means employers were basically having to poach workers from other employers, an action that drives up wages and employee attrition. The unemployment rate had dropped to 3.4% in February 2020 then peaked at 14.8% in April 2020 due to the COVID-19 black swan event. It then began a fairly rapid descent to 6.2% in February 2021.
It is interesting to compare past recessions to see how long the recovery took. The second highest unemployment rate since World War II happened in the early 1980’s global recession when unemployment peaked at 10.8% in 1982.
As the economy reopens post-COVID-19, we may soon see the longer-term unemployment impact on the economy. The following diagram shows monthly unemployment since 1948.
Historic Monthly Unemployment (1948-2020)
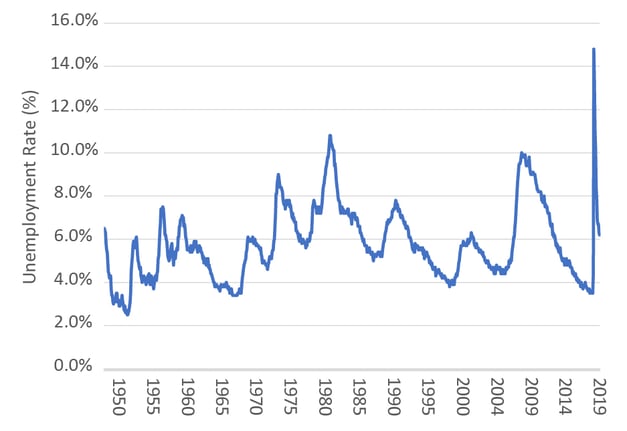 Source: Bureau of Labor and Statistics
Hospitality sector lost over 1.1 million jobs
This recession has been unlike any others in that it impacted specific industries more severely than others. Residential real estate, financial services and the IT sector were relatively untarnished. Conversely, the hospitality sector was hit the hardest by the COVID-19 recession since business and personal travel was essentially shut down. Airport and hotels were literally empty for the last year. Unemployment in the sector was a staggering 15.9% in January 2021 which has left over 1.1 million workers out of work. The impact on other industries was significantly less. The following table ranks the industries by total change in unemployed persons by industry.
Unemployment by Industry
Ranked by Total Change in Unemployed Persons
| Total Unemployed (Thousands) |
Unemployment Rate (Not Seasonally Adjusted) |
||||||
| Industry Sector | Jan-20 | Jan-21 | Change | Jan-20 | Jan-21 | Change | |
| Leisure and hospitality | 833 | 1,949 | 1,116 | 5.9 | 15.9 | 10.0 | |
| Education and health services | 601 | 1,059 | 458 | 2.4 | 4.3 | 1.9 | |
| Construction | 515 | 938 | 423 | 5.4 | 9.4 | 4.0 | |
| Professional and business services | 724 | 1,146 | 422 | 4.1 | 6.8 | 2.7 | |
| Wholesale and retail trade | 945 | 1,367 | 422 | 4.7 | 6.9 | 2.2 | |
| Transportation and utilities | 220 | 613 | 393 | 3.0 | 8.2 | 5.2 | |
| Other services | 250 | 544 | 294 | 3.7 | 8.8 | 5.1 | |
| Self-employed workers, unincorporated, and unpaid family workers | 351 | 617 | 266 | 3.6 | 6.2 | 2.6 | |
| Government wage and salary workers | 467 | 641 | 174 | 2.1 | 3.0 | 0.9 | |
| Manufacturing | 530 | 699 | 169 | 3.4 | 4.7 | 1.3 | |
| Information | 61 | 186 | 125 | 2.3 | 7.4 | 5.1 | |
| Financial activities | 259 | 350 | 91 | 2.5 | 3.4 | 0.9 | |
| Mining, quarrying, and oil and gas extraction | 16 | 93 | 77 | 1.9 | 14.2 | 12.3 | |
| Real estate and rental and leasing | 98 | 140 | 42 | 3.5 | 5.3 | 1.8 | |
| Agricultural and related private wage and salary workers | 231 | 153 | -78 | 12.5 | 9.4 | -3.1 | |
Source: Bureau of Labor and Statistics
20 metro areas with most unemployed hospitality industry workers
Due to the significant job losses in the hospitality sector, it is helpful to understand which metro areas have the most displaced workers as it can impact site selection decisions for a variety of project types. These other project types might be able to transition these workers to their industry. Some of the project types include professional service operations such as call centers and shared service centers. Workers who lost jobs in the hospitality sector could also be viable workers for retail establishments and distribution centers. The following list identifies the top 20 metro areas with the largest concentration of hospitality industry workers.
Top 20 Largest Metro Areas for Leisure & Hospitality Workers
| Rank | Metro Area | No. of Leisure & Hospitality Industry Workers | No. of Unemployed Leisure & Hospitality Industry Workers |
| 1 | New York-Newark-Jersey City, NY-NJ-PA | 846,564 | 133,254 |
| 2 | Los Angeles-Long Beach-Anaheim, CA | 759,679 | 84,941 |
| 3 | Chicago-Naperville-Elgin, IL-IN-WI | 455,190 | 58,262 |
| 4 | Dallas-Fort Worth-Arlington, TX | 383,324 | 28,870 |
| 5 | Houston-The Woodlands-Sugar Land, TX | 327,207 | 30,897 |
| 6 | Miami-Fort Lauderdale-Pompano Beach, FL | 316,636 | 32,210 |
| 7 | Washington-Arlington-Alexandria, DC-VA-MD-WV | 309,284 | 33,274 |
| 8 | Atlanta-Sandy Springs-Alpharetta, GA | 289,277 | 45,230 |
| 9 | San Francisco-Oakland-Berkeley, CA | 269,330 | 21,202 |
| 10 | Las Vegas-Henderson-Paradise, NV | 264,193 | 50,118 |
| 11 | Boston-Cambridge-Newton, MA-NH | 257,920 | 34,998 |
| 12 | Philadelphia-Camden-Wilmington, PA-NJ-DE-MD | 254,661 | 36,714 |
| 13 | Orlando-Kissimmee-Sanford, FL | 252,237 | 22,130 |
| 14 | Phoenix-Mesa-Chandler, AZ | 227,276 | 24,153 |
| 15 | Seattle-Tacoma-Bellevue, WA | 199,126 | 30,857 |
| 16 | San Diego-Chula Vista-Carlsbad, CA | 189,864 | 19,401 |
| 17 | Detroit-Warren-Dearborn, MI | 182,058 | 59,372 |
| 18 | Minneapolis-St. Paul-Bloomington, MN-WI | 175,930 | 20,541 |
| 19 | Riverside-San Bernardino-Ontario, CA | 171,693 | 24,024 |
| 20 | Denver-Aurora-Lakewood, CO | 164,128 | 36,111 |
Source: Bureau of Labor and Statistics
Conclusions
The long-term impact of the COVID-19 pandemic on the economy and labor markets is still unknown. It is evident that certain industries and metro areas have been hit harder than others. Unemployment is only one of the many factors that measures the impact and just one of the things to consider during the site selection process. As a result, it is important to carefully evaluate all site selection factors before making your next location decision.
