

by Josh Bays, on May 24, 2017 9:23:41 AM
For manufacturers seeking to expand, relocate or consolidate their production footprint, the availability of a qualified workforce is typically the primary site selection driver after the company has assessed its logistics network. When choosing the optimal locations for these labor and capital-intensive  production operations, companies should employ a comprehensive series of workforce analyses that assess the prevalence of needed skillsets in a market, as well as the market’s ability to produce a pipeline of talent into the future.
Site Selection Group, a full-service location advisory, economic incentives and real estate services firm, provides its corporate clients a full suite of workforce analytics for the purposes of mitigating hiring challenges. Based on our recent experience, it is more critical now than ever for companies to invest heavily in workforce analytics during the site selection process.
As production rises, manufacturers stretched to find qualified workers
The United States is currently experiencing the perfect storm as it relates to the tightening of the production workforce. Although there are a variety of factors that contribute to this inconvenience to domestic manufacturers, the issue can simply be explained as the demand for production skillsets in most markets has reached or exceeded the supply of readily available workers. As the national manufacturing occupation data below suggests, there has been significant growth in activity since the last economic downturn.
Production Jobs
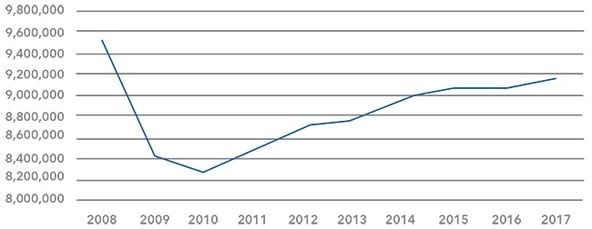
![]()
This increased production activity continues to suppress unemployment rates. Since the Great Recession, unemployment rates have dropped to less than 5%, and are currently at their lowest point. The labor force participation rate is also recovering from 2009 and slowly increasing, as seen in the chart below.
Workforce Trends
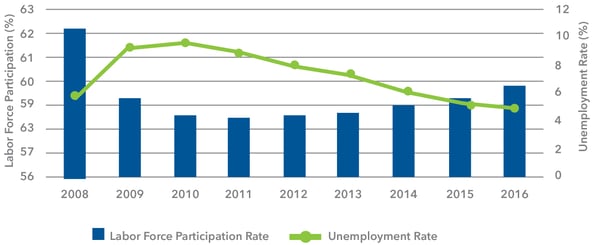
![]()
Another challenge facing many manufacturing employers is an aging workforce. As the retirement rate rises, the labor market tightens even further as manufacturing employers search to replenish their skilled production workforce. Approximately 30% of the production workforce is aged 45 to 54 as show in the chart below.
Age Distribution of Production Workers

![]()
Most secondary data resources focus on the supply side of the equation
There are two types of data used when conducting workforce analytics, primary and secondary resources. Primary data sources are those that provide real-time information based on operational experience. These sources include existing employers, colleges and vocational schools, workforce development agencies, staffing agencies and the like. Although Site Selection Group believes primary data sources should be at the core of a comprehensive workforce analysis, they are difficult to leverage when filtering through a lengthy list of candidate communities. Therefore, this type of data is often used in later phases of a site selection project.
When conducting workforce analytics at a macro-level, the use of best-in-class secondary data sources becomes critical. Secondary data sources are those that aggregate data across the entire country, and include entities such as the federal government and a variety of third-party data modelers. However, companies should understand the limitations associated with secondary data sources. Despite their level of quality, secondary sources typically lag 12 months which is problematic in a dynamic economy. In addition, secondary data sources are heavily focused on the workforce supply side of the equation and do little to shed light on the demand for certain skillsets.
For example, the following table is a simple illustration of supply-focused occupation statistics for machinists from secondary sources. This table shows the top metro areas ranked by number of machinists. Clearly, Chicago is home to many machinists as demonstrated in this table. However, this data set serves as a poor indicator to assess the hiring pressures in the market.
Top Metro Areas by Total Number of Machinists
| Metro Area | Total Machinists |
Labor Force |
Machinists % of LF |
|---|---|---|---|
| Chicago-Naperville-Elgin, IL-IN-WI | 21,499 | 5,091,165 | 0.42% |
| Los Angeles-Long Beach-Anaheim, CA | 15,016 | 7,008,900 | 0.21% |
| Detroit-Warren-Dearborn, MI | 13,830 | 2,156,333 | 0.64% |
| Houston-The Woodlands-Sugar Land, TX | 11,441 | 3,515,448 | 0.33% |
| Minneapolis-St. Paul-Bloomington, MN-WI | 7,719 | 2,029,206 | 0.38% |
| Dallas-Fort Worth-Arlington, TX | 7,619 | 3,850,496 | 0.20% |
| New York-Newark-Jersey City, NY-NJ-PA | 7,034 | 10,610,411 | 0.07% |
| Cleveland-Elyria, OH | 6,640 | 1,070,498 | 0.62% |
| Seattle-Tacoma-Bellevue, WA | 6,463 | 2,055,910 | 0.31% |
| Boston-Cambridge-Newton, MA-NH | 5,586 | 2,735,900 | 0.20% |
| Milwaukee-Waukesha-West Allis, WI | 5,502 | 841,665 | 0.65% |
| Cincinnati, OH-KY-IN | 5,220 | 1,133,070 | 0.46% |
| Philadelphia-Camden-Wilmington, PA-NJ-DE-MD | 5,079 | 3,196,170 | 0.16% |
| Phoenix-Mesa-Scottsdale, AZ | 4,638 | 2,273,199 | 0.20% |
| Pittsburgh, PA | 4,017 | 1,223,763 | 0.33% |
| Atlanta-Sandy Springs-Roswell, GA | 3,973 | 3,044,951 | 0.13% |
| Charlotte-Concord-Gastonia, NC-SC | 3,969 | 1,315,025 | 0.30% |
| Greenville-Anderson-Mauldin, SC | 3,659 | 433,434 | 0.84% |
| San Diego-Carlsbad, CA | 3,622 | 1,656,670 | 0.22% |
| Hartford-West Hartford-East Hartford, CT | 3,550 | 669,956 | 0.53% |
![]()
Using job postings data to assess the demand for certain skillsets
Site Selection Group employs a balanced approach with regard to workforce analytics in order to better assess both supply and demand. One of the few secondary data sources available for assessing the demand for skillsets in a market is job postings data. When comparing job postings in a market to the number of people employed in a specific occupation, one can get a sense of the hiring pressures that exist in a market. The following table shows the top 10 metro areas with the highest job posting activity for machinists relative to the total number of machinists employed. The higher the proportion, the more competitive a market is for the machinist skillset.
Metro Areas by High Demand for Machinists
| Metro Area | Demand: Postings as % of Jobs |
Average Monthly Job Postings |
# of |
5-Year Occupation Growth |
|---|---|---|---|---|
| Odessa, TX | 9.69% | 66 | 681 | -17.60% |
| Lafayette, LA | 9.00% | 133 | 1,477 | -18.10% |
| Greeley, CO | 8.41% | 46 | 547 | 53.20% |
| Flint, MI | 8.06% | 47 | 583 | -4.00% |
| Peoria, IL | 7.66% | 64 | 835 | -35.30% |
| Houma-Thibodaux, LA | 7.45% | 43 | 577 | -28.10% |
| Lansing-East Lansing, MI | 7.45% | 107 | 1,436 | 23.90% |
| Ottawa-Peru, IL | 7.23% | 37 | 512 | 14.50% |
| Muskegon, MI | 7.18% | 69 | 961 | 22.10% |
| Blacksburg-Christiansburg-Radford, VA | 7.17% | 39 | 544 | 37.40% |
![]()
Conversely, Site Selection Group has also identified those 10 metro areas with the lowest job posting activity for machinists. Again, this data suggests that these metro areas are experiencing low demand for machinists relative to other national markets.
Top Metro Areas by Low Demand for Machinists
| Metro Area | Demand: Postings as % of Jobs |
Average Monthly Openings |
# of Jobs |
5-Year Occupation Growth |
|---|---|---|---|---|
| Bridgeport-Stamford-Norwalk, CT | 3.20% | 36 | 1,155 | -2.70% |
| Tucson, AZ | 3.70% | 27 | 740 | 2.20% |
| Scranton--Wilkes-Barre--Hazleton, PA | 3.70% | 21 | 570 | -0.30% |
| Philadelphia-Camden-Wilmington, PA-NJ-DE | 3.80% | 191 | 5,079 | 0.00% |
| New Haven-Milford, CT | 3.80% | 48 | 1,264 | -2.60% |
| York-Hanover, PA | 3.90% | 43 | 1,097 | -1.10% |
| Hartford-West Hartford-East Hartford, CT | 3.90% | 140 | 3,550 | 1.20% |
| Syracuse, NY | 4.00% | 22 | 545 | -0.20% |
| Los Angeles-Long Beach-Anaheim, CA | 4.00% | 595 | 15,016 | 3.50% |
| Canton-Massillon, OH | 4.00% | 31 | 773 | -3.00% |
![]()
Employ a balanced approach to workforce analytics
Site Selection Group recommends companies invest in comprehensive workforce analytics to mitigate the hiring challenges associated with siting a new manufacturing plant. However, companies must take a prudent approach and integrate best-in-class primary and secondary data sources that assess both supply and demand. Secondary data sources can be valuable in the preliminary phases of the site selection process to compare a large set of candidate communities. Nevertheless, the importance of primary data sources is critical to a thorough workforce assessment.
