

by Josh Bays, on May 22, 2019 9:23:31 AM
One of the biggest challenges companies face when expanding their distribution footprint is the lack of available real estate product in favorable locations that have the capacity to support their project. Site Selection Group, a full-service location advisory, real estate and economic incentive services firm, monitors industrial activity in the United States. Over the past quarter, warehouse inventory has diminished as corporate expansions outpace construction.
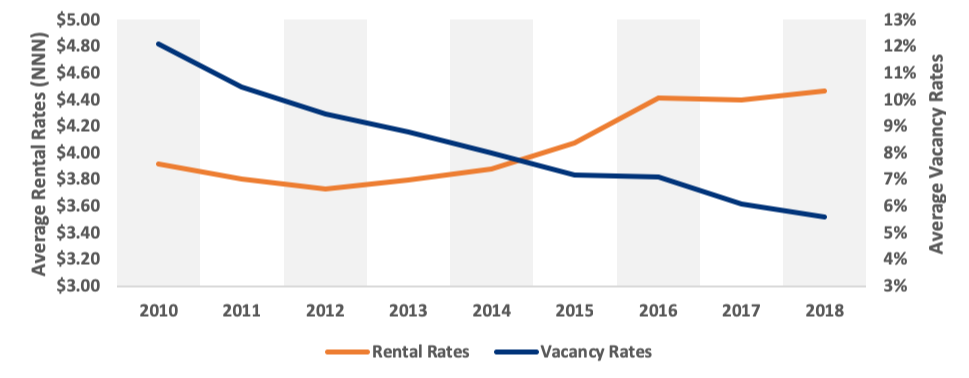
National industrial vacancy rates have been steadily declining
Vacancy rates have been steadily falling post-2010, while rental rates continue to rise, though in recent years this growth has slowed. The graph below displays this trend.
National Distribution Center Vacancy and Rental Rates
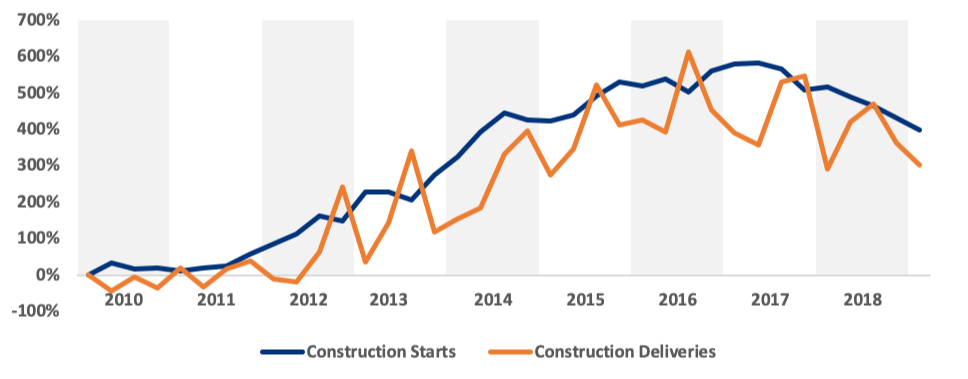
National construction starts and deliveries have been slowly decreasing
From 2010-2016, national construction starts and deliveries steadily increased on an annual basis, but construction starts appear to have peaked at the end of 2016. If this trend continues, the constrained industrial real estate market will likely further tighten as deliveries taper off. The following chart shows the change in national construction starts and deliveries since 2010 by quarter.
National Growth Trends in Distribution Center Real Estate
 Construction activity is still active in the large population centers
Although industrial construction activity appears to be slowing on a national scale, there are still several very active markets. Construction activity seems to be correlated to high population centers to reduce delivery times to customers as the bulk of large industrial leases are e-commerce or retail fulfillment related. The following interactive map shows the 40 markets with highest construction activity in Q1 2019 and is shaded by average rental rates.
Top 20 industrial leases of Q1 2019
The following chart shows the largest industrial leases in the United States during the first quarter of 2019. Unsurprisingly, eight of the most active industrial real estate markets appear on this list.
| Company | Square Feet | Address | Metro Area |
|---|---|---|---|
| MillerCoors | 1,300,281 | 863 E Meadow Rd | Greensboro-High Point, NC |
| Lowe's | 1,200,000 | 4532 United Dr | Vineland-Bridgeton, NJ |
| The J.M. Smucker Co. | 1,075,260 | 1200 Fulghum Rd | Dallas-Fort Worth-Arlington, TX |
| Undisclosed | 1,004,674 | E Cleveland Rd | Dallas-Fort Worth-Arlington, TX |
| PVH Corp | 982,777 | 8500 Tatum Rd | Atlanta-Sandy Springs-Alpharetta, GA |
| PepsiCo | 912,552 | 5510 Exploration Dr | Indianapolis-Carmel-Anderson, IN |
| Tesla Motors | 870,240 | 17100 S Murphy Pkwy | Stockton, CA |
| Barrett Distribution | 829,464 | 6100 E Holmes Rd | Memphis, TN-MS-AR |
| ULINE | 810,899 | 3131 Hogum Bay Rd | Olympia-Lacey-Tumwater, WA |
| Quaker Distribution | 802,390 | 1901 Beggrow St | Columbus, OH |
| Home Depot | 770,640 | Fallbrook Dr | Houston-The Woodlands-Sugar Land, TX |
| CTDI | 705,955 | 1753 Chaplin Dr | Dallas-Fort Worth-Arlington, TX |
| Steelcase | 611,576 | 12400 Arrow Rt | Riverside-San Bernardino-Ontario, CA |
| William Sonoma | 597,818 | 6101 Sierra Ave | Riverside-San Bernardino-Ontario, CA |
| Fresenius Kabi | 590,525 | 120th Ave & 122nd St | Chicago-Naperville-Elgin, IL-IN-WI |
| Barrett Distribution | 590,000 | 152 Route 206 | New York-Newark-Jersey City, NY-NJ-PA |
| XPO Logistics | 553,592 | 1350 N Waterman Ave | Riverside-San Bernardino-Ontario, CA |
| Undisclosed | 550,000 | 300 Park Center Dr | Winchester, VA-WV |
| Undisclosed | 514,491 | 3538 TradePort Ct | Columbus, OH |
| Undisclosed | 505,735 | 15097 Van Vliet Ave | Riverside-San Bernardino-Ontario, CA |
Source: Costar
