Top Incentive Deals for Distribution Centers in the First Half of 2019
by Josh Bays, on Jun 25, 2019 5:26:05 PM
When evaluating their distribution networks, companies should also to consider the effect incentives may have on their bottom line. While no company should make a location decision based off incentives, it can be a differentiator between two good communities and play a significant role in supply-chain decisions.
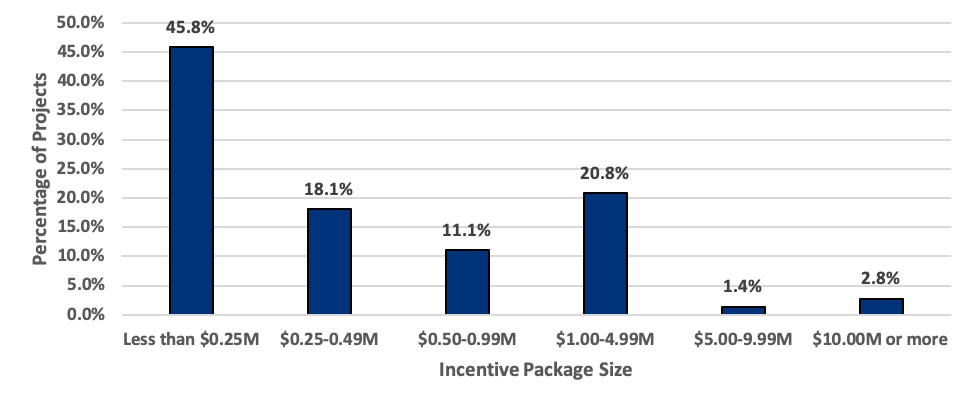
Site Selection Group, a full-service location advisory, real estate and economic incentive services firm, has tracked distribution center incentive packages over the past six months. While a large percentage of projects have received relatively modest packages (over 60% came in at less than $500,000), over 20% have received benefits ranging from $1 million to $5 million, which can make a large impact in offsetting capital investment.
However, not all projects are created equal. For distribution center projects that announced an incentive package in the first half of 2019, the average capital investment was $16.1 million and an average of 230 jobs were created. This relationship is detailed further below.
Jobs and capital investment impact distribution center economic incentive packages
The average incentive package awarded to distribution center projects over the first half of 2019 was $1.92 million. Of the 64% of projects receiving $500,000 or less in economic incentives, the average job creation and capital investment was 102 positions and $6.3 million, respectively. Of the 12.5% of projects receiving over $2.5 million in incentives, the average job creation and capital investment was 900 positions and $44 million, respectively.
Smaller projects should not be discouraged, however. For those projects awarded less than $500,000, the incentive package represented a benefit of over $6,500 per job created, which can be meaningful to the bottom line. The table below shows how economic incentives were divided among distribution center projects.
Economic Incentive Packages by Size
 Mid-size markets incentivized jobs the most
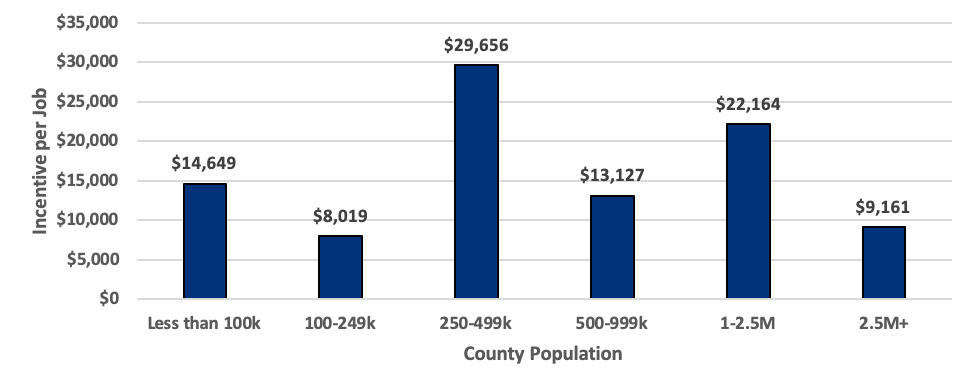
Over the past six months, mid-sized markets incentivized distribution center projects more competitively than small and large markets. This trend could indicate that while larger markets certainly have plenty of activity and funds, they are focusing their incentive attention elsewhere.
Economic incentives per jobs created by community size
 Top economic incentive packages for distribution centers
The following table shows the top economic incentive packages awarded to distribution centers over the past six months.
| Company | Location | Capital Investment ($M) | Job Creation | Awarded Incentives ($M) |
|---|---|---|---|---|
| Boeing | Dallas, TX | $0.00 | 100 | $73.00 |
| Big Y Foods | Springfield, MA | $46.00 | 32 | $4.60 |
| RPM Freight Systems | Royal Oak, MI | $4.90 | 500 | $3.75 |
| Rooms To Go | Lebanon, TN | $69.00 | 200 | $3.40 |
| Argos Holdings | Salisbury, NC | $55.00 | 1,200 | $2.87 |
| 1661 (GOAT) | Los Angeles, LA | $3.00 | 298 | $2.73 |
| The Gap | Groveport, OH | $100.00 | 600 | $2.70 |
| Cordova Coolers | Nampa, ID | $6.00 | 39 | $2.00 |
| United Technologies | Jacksonville, FL | $21.80 | 108 | $1.64 |
| Menards | Cuyahoga Falls, OH | $81.48 | 150 | $1.62 |
