

by Josh Bays, on Jul 23, 2019 2:04:03 PM
An increase in e-commerce activity and consumer buying patterns has had a profound impact on national supply chains. It is critical for the industrial sector to keep up with the demand for on-time and accurate delivery. Given the nationwide tight labor market, it is more important than ever for companies to thoroughly evaluate the regional workforce.
In a quickly changing industrial landscape, it is also important to have up-to-date information. Site Selection Group, a full-service location advisory, economic incentives, and real estate services firm, helps distribution centers find the optimal locations for their projects by evaluating workforce, logistics efficiencies, business environment, infrastructure, facilities, and economic incentives. Since our newsletter last year, the demand for tractor-trailer drivers has continued to grow. See the charts below to get the most up-to-date data available.
Tractor-trailer truck driver numbers on the rise
In 2017, tractor-trailer occupations reached pre-Great Recession levels and have continued to see steady growth, adding over 40,000 jobs in the past year. Since the lowest point in employment numbers following the recession in 2010, there have been roughly 24% growth in this sector. Based on recent project experience, as well as economic forecasts, this growth is likely to continue well into the future.
Heavy and Tractor Trailer Truck Drivers
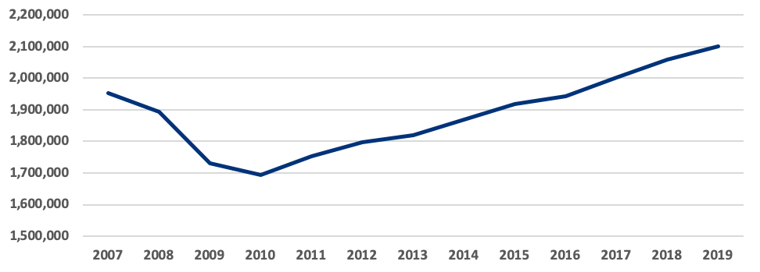
Source: EMSI
Labor supply by the numbers
The total supply of key occupation types is often the starting point for accessing labor availability. The table below shows the top metro areas in 2019 by the presence of tractor-trailer drivers. While there was some slight reshuffling, the top five cities remain the same as last year. Kansas City fell off the list, while St. Louis was added. Of the markets represented here, Memphis has the highest concentration of tractor-trailer drivers relative to the overall labor force.
Top Metro Areas by Total Number of Tractor Trailer Drivers
| Metro Area | Total Tractor Trailer Drivers | Labor Force | Drivers as % of LF |
|---|---|---|---|
| New York-Newark-Jersey City, NY-NJ-PA | 73,947 | 9,944,480 | 0.74% |
| Dallas-Fort Worth-Arlington, TX | 64,599 | 4,077,238 | 1.58% |
| Chicago-Naperville-Elgin, IL-IN-WI | 59,049 | 5,079,438 | 1.16% |
| Los Angeles-Long Beach-Anaheim, CA | 53,345 | 6,838,889 | 0.78% |
| Houston-The Woodlands-Sugar Land, TX | 46,363 | 3,705,456 | 1.25% |
| Atlanta-Sandy Springs-Alpharetta, GA | 40,583 | 3,215,504 | 1.26% |
| Miami-Fort Lauderdale-Pompano Beach, FL | 30,902 | 3,284,088 | 0.94% |
| Riverside-San Bernardino-Ontario, CA | 30,519 | 2,066,994 | 1.48% |
| Philadelphia-Camden-Wilmington, PA-NJ-DE-MD | 29,523 | 3,147,943 | 0.94% |
| Detroit-Warren-Dearborn, MI | 26,839 | 2,060,057 | 1.30% |
| Minneapolis-St. Paul-Bloomington, MN-WI | 21,572 | 2,093,734 | 1.03% |
| Phoenix-Mesa-Chandler, AZ | 21,563 | 2,408,055 | 0.90% |
| Boston-Cambridge-Newton, MA-NH | 20,238 | 2,687,517 | 0.75% |
| Indianapolis-Carmel-Anderson, IN | 20,110 | 1,051,851 | 1.91% |
| Charlotte-Concord-Gastonia, NC-SC | 19,852 | 1,349,628 | 1.47% |
| Seattle-Tacoma-Bellevue, WA | 18,885 | 2,239,312 | 0.84% |
| St. Louis, MO-IL | 18,436 | 1,487,255 | 1.24% |
| Washington-Arlington-Alexandria, DC-VA-MD-WV | 18,429 | 3,703,622 | 0.50% |
| Nashville-Davidson--Murfreesboro--Franklin, TN | 18,227 | 1,026,196 | 1.78% |
| Memphis, TN-MS-AR | 17,510 | 652,712 | 2.68% |
Source: EMSI; MSAs with at least 500 tractor-trailer drivers
Assessing labor demand
Using jobs postings, Site Selection Group gathers a more complete view of labor availability. An area with high demand has a relatively larger number of postings relative to existing jobs. An ideal community will offer both a larger-than-average labor supply and a lower-than-average labor demand. The table below shows the areas with the highest demand for tractor-trailers drivers this year.
Metro Areas by High Demand for Tractor Trailer Drivers
| Metro Area | Demand: Postings as % of Jobs | Average Monthly Job Postings | # of Occupation |
|---|---|---|---|
| Peoria, IL | 1782.33% | 2,284 | 1,538 |
| Terre Haute, IN | 1183.71% | 1,201 | 1,217 |
| Charleston, WV | 1098.08% | 1,687 | 1,844 |
| Ottawa, IL | 1095.92% | 1,660 | 1,818 |
| Columbus, GA-AL | 970.41% | 928 | 1,147 |
| Bloomington, IL | 916.93% | 791 | 1,035 |
| Topeka, KS | 910.05% | 917 | 1,209 |
| Huntington-Ashland, WV-KY-OH | 895.72% | 1,394 | 1,868 |
| Pottsville, PA | 894.60% | 1,149 | 1,541 |
| Lafayette-West Lafayette, IN | 869.74% | 962 | 1,327 |
Source: EMSI; MSAs with at least 1,000 tractor-trailer drivers
Likewise, Site Selection Group also identified those metro areas with the lowest demand for tractor-trailer drivers (see below). As a reminder, this demand metric alone doesn’t give a broad view of labor availability. It is merely an indicator of the overall workforce, but shouldn’t be used by itself.
Top Metro Areas by Low Demand for Tractor Trailer Drivers
| Metro Area | Demand: Postings as % of Jobs | Average Monthly Job Postings | # of Occupation |
|---|---|---|---|
| Urban Honolulu, HI | 16.78% | 43 | 3,057 |
| Miami-Fort Lauderdale-Pompano Beach, FL | 46.72% | 1,203 | 30,902 |
| Midland, TX | 53.07% | 200 | 4,528 |
| Anchorage, AK | 56.32% | 66 | 1,413 |
| Odessa, TX | 62.96% | 205 | 3,909 |
| Williston, ND | 76.72% | 102 | 1,593 |
| Carlsbad-Artesia, NM | 77.86% | 94 | 1,455 |
| Naples-Marco Island, FL | 80.17% | 71 | 1,069 |
| El Paso, TX | 82.43% | 521 | 7,587 |
| Hobbs, NM | 82.95% | 115 | 1,662 |
Source: EMSI; MSAs with at least 1,000 tractor-trailer drivers
