

by Cyrus Mortazavi, on Apr 12, 2024 8:00:00 AM
The aging workforce in the manufacturing industry, especially in traditional sectors, poses a significant risk of skill shortages due to a larger share approaching retirement age. The following analysis discusses some key takeaways for which states and manufacturing sectors are at the most risk due to an aging workforce.
Manufacturing sectors with aging workforces
First, Site Selection Group, a leading location advisory, economic incentives and real estate services firm, examined the manufacturing sectors that tend to have an older workforce. There are different ways to measure workforce age, but for this analysis, Site Selection Group looked at sectors in the manufacturing industry using BLS 2022 data with a higher and lower proportion of workers 55 and older – nearing retirement age. The table below shows the five manufacturing sectors with the greatest share of workers ages 55 and over.
Industry (3-digit NAISC) |
Percent of 55+ year old workers |
| Textiles, apparel, and leather manufacturing | 32.70% |
| Paper manufacturing and printing | 29.90% |
| Machinery manufacturing | 28.80% |
| Primary metals and fabricated metal products manufacturing | 28.80% |
| Plastics and rubber products manufacturing | 28.20 |
Growth among traditional manufacturing sectors, such as textiles and paper manufacturing, has declined in the U.S. in recent decades resulting in older workforces in these sectors. It could also be that these industries face challenges in recruiting younger workers – posing threats to knowledge transfer, workforce succession planning and productivity and innovation. Regardless, sectors with greater shares of an aging workforce face significant risks due to impending retirements.
On the other hand, the following table shows the five manufacturing sectors with the lowest share of workers ages 55 and over.
Industry (3-digit NAISC) |
Percent of 55+ year old workers |
| Petroleum and coal products manufacturing | 17.70% |
| Beverages and tobacco products manufacturing | 19.80% |
| Chemicals manufacturing | 21.20% |
| Food manufacturing | 21.90% |
| Electrical equipment and appliances manufacturing | 23.30% |
As seen above, the petroleum and coal products manufacturing sector has the lowest share of manufacturing workers aged 55 and over, indicating older workers may be less attracted to more physically demanding roles that are frequently found in the oil and gas sectors. Further, these sectors have a smaller proportion of workers approaching retirement, thus these industries face a lower immediate risk of skill shortages as a result of the smaller share of people aged 55 and up.
Manufacturing sectors with the greatest increase in aging workforce
Various sectors of the manufacturing industry experience growth or decline, influenced by consumer demand each year. In the last 10 years, the manufacturing industry has seen considerable technological progress spurred by the need for speed-to-market and globalization.
The table below shows the five manufacturing sectors that experienced the most growth between 2012 and 2022 using BLS data from the respective years. Each year’s value represents the share of manufacturing workers aged 55 and over for each sector, with the percent change being the difference between the 2022 and 2012 values.
Most Growth: Industry (3-digit NAISC) |
2012 |
2022 |
% Change |
| Textiles, apparel, and leather manufacturing | 23.10% | 32.70% | 9.60% |
| Furniture and related product manufacturing | 20.50% | 28.20% | 7.70% |
| Wood products manufacturing | 20.40% | 28.00% | 7.60% |
| Plastics and rubber products manufacturing | 21.80% | 28.20% | 6.40% |
| Paper manufacturing and printing | 24.00% | 29.90% | 5.90% |
Textiles, apparel, and leather manufacturing experienced the most significant aging trends as the rapid increase in the proportion of older workers could signal the need for aging sectors to rethink their workforce strategy. The textiles, apparel, and leather manufacturing; furniture manufacturing; and the paper manufacturing and printing sectors have experienced a decline in the U.S. due to offshoring. However, Site Selection Group has observed an increase in reshoring for the wood products and plastics and rubber manufacturing sectors.
The following table is similar to the preceding one, however this table shows the five manufacturing sectors that experienced the smallest increase in the share of workers 55 and over during the past 10 years – in short, these are sectors that show a lower risk of workforce retirements.
Latest Growth: Industry (3-digit NAISC) |
2012 |
2022 |
% Change |
| Petroleum and coal products manufacturing | 20.30% | 17.70% | -2.50% |
| Nonmetallic mineral products manufacturing | 26.60% | 25.50% | -1.10% |
| Chemicals manufacturing | 22.20% | 21.20% | -1.00% |
| Beverages and tobacco products manufacturing | 19.50% | 19.80% | 0.30% |
| Electrical equipment and appliances manufacturing | 21.50% | 23.30% | 1.80% |
The sectors of manufacturing listed above exhibited the lowest growth rates over the past decade suggesting that these sectors may face less immediate pressure from an aging workforce, thus a more stable employment landscape is present in terms of age distribution.
A dual perspective of sector-based and geographic age distribution
In addition to a sector-based analysis, Site Selection Group also analyzed aging manufacturing trends at the geographic level. Both maps use Lightcast 2023 data to show the distribution of people by state. The first map shows older states based on overall population data and the second map shows older states based on workforce data. In both maps, states shaded in a deep red indicate a greater share of people aged 55 and over while states shaded in a deep green indicate a lower share of people aged 55 and over.
55+ Population Data
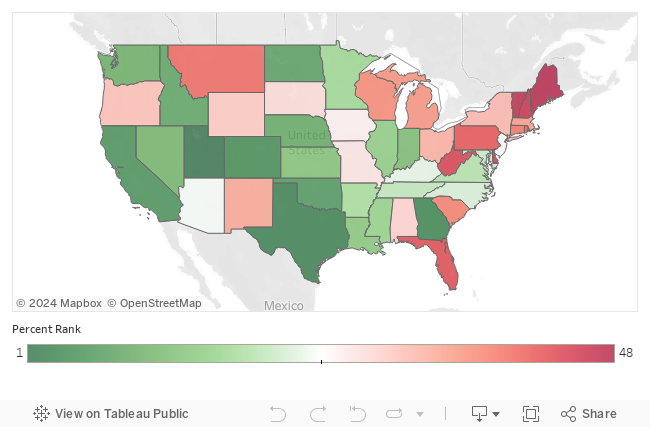
This data points to aging populations clustering in the northeastern U.S., but also in retirement destinations such as Florida and South Carolina. Conversely, faster-growing states such as Utah and Texas tend to have younger populations.
55+ Workforce Data
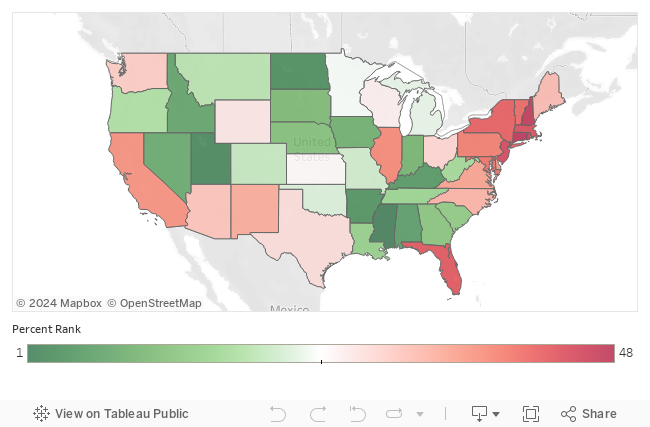
When comparing the two maps against one another, states such as West Virginia and South Carolina have a greater proportion of their general population being older but a lower proportion of an older population in their manufacturing workforce. That’s why it’s critical to look at both detailed demographic trends but also industry-specific trends. For example, South Carolina’s overall demographics are impacted by the large number of retirees heading to the state, but its overall manufacturing age profile is relatively more favorable. Further, states like those in the Northeast with an older overall population and a larger share of workers in the manufacturing sector approaching retirement age could have more long-term workforce risk. Regardless, it is important to conduct an in-depth workforce analysis that addresses a company’s goals to address and balance these risks.
Key takeaways
An aging workforce has proven to be a significant challenge across multiple sectors within the manufacturing industry as traditional sectors tend to hold greater shares of manufacturing workers ages 55 and over. Many traditional sectors pose risks of an aging population as they’ve experienced the greatest increase in the proportion of older workers over the past decade threatening their long-term success. Companies can mitigate these risks by examining their manufacturing footprint to assess short- and long-term risks from an aging workforce.
