

by Josh Bays, on Aug 19, 2020 8:03:32 AM
Even in the midst of the pandemic, one of the current challenges companies face when expanding their distribution footprint is the competition for available real estate product in favorable locations. Site Selection Group, a full-service location advisory, real estate and economic incentive services firm, monitored activity in the industrial space over the second quarter of 2020. Given the current uncertainty in the marketplace, the results might be shocking to some.
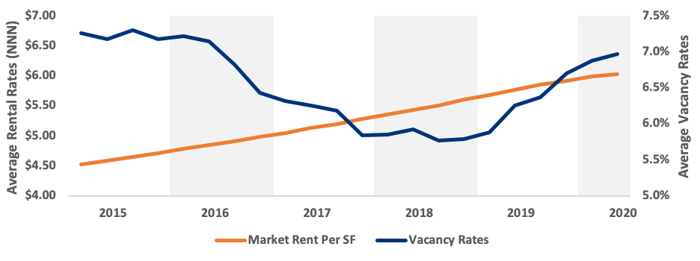
Recent increases in national industrial vacancy rates and market rent
Market rent has grown steadily over the past several 10 years, and this past quarter saw that trend continue despite COVID-19. Conversely, vacancy rates have historically tightened, though this trend has begun to reserve in recent years, mainly due to supply of product coming on the market. The graph below displays the latest data for these trends.
National Distribution Center Vacancy and Rental Rates
 National construction starts are down; deliveries are increasing
Nationwide, construction deliveries outpaced construction starts in Q2 2020. Roughly 37.9M SF of distribution real estate construction started in Q2 of 2020, a slight decrease from the same time period of 2019. However, construction deliveries have increased by 7.2M SF as compared to last year.
National Growth Trends in Distribution Center Real Estate
| Q2 2020 Value | Δ from Previous Quarter | Δ from Previous Year | |
|---|---|---|---|
| Construction Starts | 37.9M SF | -10.3M SF | -0.8M SF |
| Construction Deliveries | 52.8M SF | +11.8M SF | +7.2M SF |
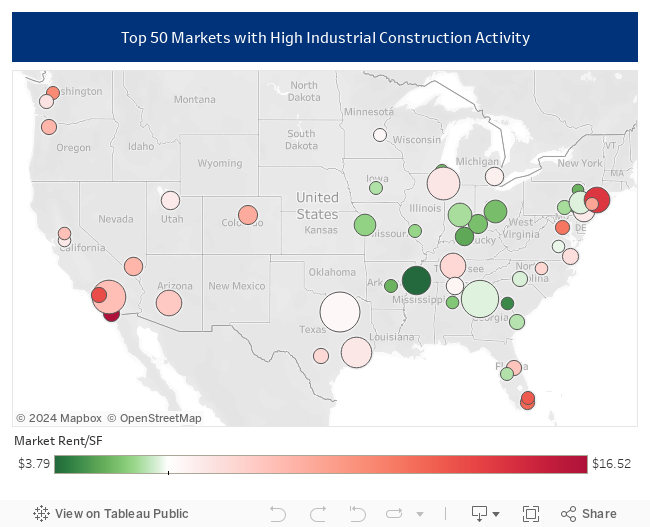
Construction activity is still active in the large population centers
Although industrial construction activity appears to be slowing on a national scale, there are still several very active markets. Construction activity seems to be correlated to high population centers to reduce delivery times to customers as the bulk of large industrial leases are e-commerce or retail fulfillment related. The following interactive map shows the 50 markets with the most industrial real estate under construction and is shaded by average rental rates.
20 Notable Distribution Leases So Far in 2020
The following chart shows 20 notable distribution leases in the United States in 2020. Unsurprisingly, many of the most active industrial real estate markets appear on this list.
| Company Name | SF Occupied | Market |
|---|---|---|
| Amazon | 2,850,000 | Cincinnati, OH |
| Amazon | 2,700,000 | Augusta, GA |
| Big Lots | 1,297,000 | Durant, OK |
| Amazon | 1,190,700 | Hagerstown, MD |
| Amazon | 1,128,400 | Atlanta, GA |
| Amazon | 1,053,360 | Jefferson, GA |
| Geodis | 1,031,524 | Allentown, PA |
| Cooper Tires | 1,000,000 | Indianapolis, IN |
| Amazon | 953,595 | New York, NY |
| Amazon | 823,173 | Chicago, IL |
| Amazon | 810,900 | Chicago, IL |
| FedEx | 776,630 | Dallas, TX |
| Amazon | 750,000 | Chicago, IL |
| Big Lots Inc. | 713,119 | Columbus, OH |
| Custom Goods LLC | 647,785 | Greenville, SC |
| Amazon | 619,200 | Los Angeles, CA |
| Amazon | 617,055 | Ocala, FL |
| Fresenius Medical Care | 614,000 | Knoxville, TN |
| Allied West Paper Corp | 611,968 | Riverside, CA |
| Mars Petcare | 610,806 | Dallas, TX |
Source: Costar
