

by Brett Bayduss, on Jun 9, 2020 3:42:32 PM
As a followup to a blog Site Selection Group recently published regarding state level unemployment rate increases due to the COVID-19 pandemic, Site Selection Group has released this summary for unemployment rate changes by metro areas. It remains apparent that although the long-term impact of COVID-19 on the economy remains uncertain, the impact on unemployment rates varies greatly both at a state level and at a metro level. There is a 30- to 60-day lag time from when the most current unemployment rates are released, so unfortunately, it is very difficult to consistently measure unemployment rates across all metro levels in real-time measurement.
The April unemployment rates by metro level were just released on June 3 by the Bureau of Labor Statistics indicating the city-level impact. Site Selection Group has provided a summary of the key findings from the most recent metro-level unemployment rate data from the Bureau of Labor Statistics to help you navigate these challenging economic conditions.
Two-month metro-level unemployment rate changes range from 0.3% to 32.4%
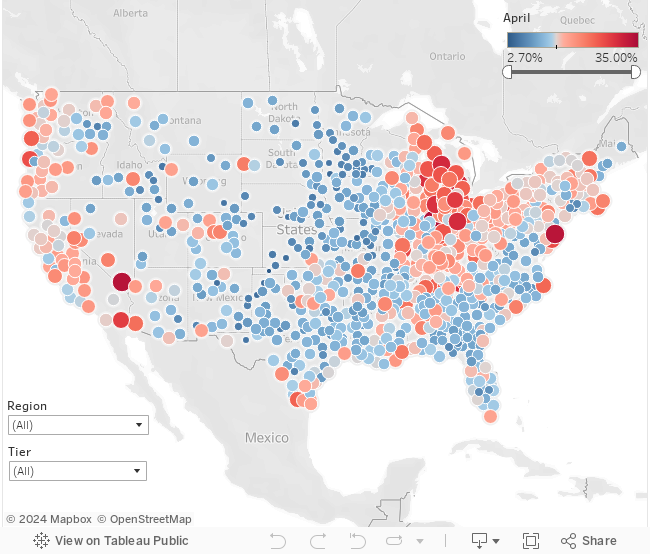
The two-month increase in unemployment by metro level ranges from 0.3% to 32.4%. Deming, New Mexico, had the smallest increase by only 0.3% but the February unemployment rate was very high at 17.3% (the highest in the country) and only slightly increased to 17.6% in April. Also noteworthy is 370 of the 925 total metro areas have an unemployment rate change increase of over 10% within the last two months. This represents 40% of all metro areas. Approximately 80% of all metro areas have a current unemployment rate at or above 10%. To place this in greater context, only nine metro areas had an unemployment rate at or above 10% in February. The lowest unemployment rate by metro area during the month of February was 1.6% as compared to 2.7% in April. The highest unemployment rate by metro area in February was 17.3% as compared to 35% in April. The following map summarizes unemployment by metro area and the increase between February and April:
US Unemployment Rate by Metro Area (April 2020)
Hawaii has two metro areas with the highest unemployment rates
Two metro areas in Hawaii have the highest unemployment rates in the country. Kahului-Lahaina and Kapaa have April unemployment rates of 35% and 34.4% respectively. In the previous blog we listed Nevada as the state with the highest unemployment rate in April. Not surprisingly, Las Vegas has the fourth highest metro-level unemployment rate at 33.5% which is most likely attributed to Las Vegas dominance in the travel, tourism, hospitality and entertainment sectors. Las Vegas also has the fourth greatest increase in unemployment from February to April of almost 30%. The 10 highest unemployed metro areas have approximately 30% or higher unemployment rates. The top 100 metro areas with the highest unemployment rates are all at or above 20%. Listed below are the 10 metro areas with the highest unemployment rate along with their increase from February.
10 Metro Areas with Highest Unemployment Rate
| Rank | Metro Area | State | April 2020 Unemployment | Increase between February to April |
|---|---|---|---|---|
| 1 | Kahului-Lahaina | HI | 35.00% | 32.40% |
| 2 | Kapaa | HI | 34.40% | 31.60% |
| 3 | Kokomo | IN | 34.10% | 30.30% |
| 4 | Las Vegas | NV | 33.50% | 29.60% |
| 5 | Atlantic City | NJ | 33.30% | 26.90% |
| 6 | Sturgis | MI | 30.30% | 27.10% |
| 7 | Cadillac | MI | 30.30% | 25.50% |
| 8 | Flint | MI | 30.10% | 26.00% |
| 9 | Bellefontaine | OH | 30.10% | 25.90% |
| 10 | Sevierville | TN | 29.50% | 23.30% |
COVID-19 creates unemployment trends at the regional level
The regional breakdown of metro areas generates interesting findings as well. Overall the Midwest has a large concentration of high unemployed metro areas. Over half of the top 20 highest unemployed metro areas are within the Midwest states, and 30 of the highest 50 unemployed metro areas are in the Midwest. Michigan, alone, has 17 of the highest 50 unemployed metro areas. Sturgis, Cadillac, Flint, Muskegon, Adrian and Hillsdale are the metro areas with the highest unemployment rates within Michigan. Indiana is the next highest with eight metro areas within the top 50. Kokomo, Indiana, has the highest unemployment rate in the Midwest at 34.1%.
The Southeast states also have a high concentration of metro areas with high unemployment rates. Tennessee and Mississippi comprise the majority of the top 10 highest unemployed metro areas in the Southeast. Sevierville, Tennessee, has the highest unemployment rate in the Southeast at 29.5%. The 10 highest unemployed metro areas in the Southeast range in their unemployment rates from 21.4% to 29.5%.
The Southwest has the least number of metro areas within the top 50. Rio Grande City-Roma, Texas, and Yuma, Arizona, have the highest unemployment rates in the Southwest at 24.3% and 23.1% respectively. They rank 37 and 48 on a national basis. Every other metro area in the Southwest has unemployment rates below 20%.
The following tables provide a summary of state unemployment conditions as well as regional and national rankings:
Mid-Atlantic Region
| Metro Area | National Rank | Regional Rank | April Unemployment | Increase between February to April |
|---|---|---|---|---|
| Mount Gay-Shamrock, WV | 47 | 1 | 23.20% | 15.70% |
| Elkins, WV | 125 | 2 | 18.80% | 11.90% |
| Beckley, WV | 138 | 3 | 18.40% | 12.40% |
| Weirton-Steubenville, WV | 144 | 4 | 18.30% | 12.00% |
| Charleston, WV | 153 | 5 | 18.00% | 12.80% |
| Wheeling, WV-OH | 173 | 6 | 17.50% | 10.70% |
| Fairmont, WV | 193 | 7 | 17.20% | 12.10% |
| Parkersburg-Vienna, WV | 218 | 8 | 16.80% | 10.70% |
| Huntington-Ashland, WV-KY-OH | 222 | 9 | 16.70% | 11.30% |
| Salisbury, MD-DE | 255 | 10 | 16.10% | 10.60% |
Midwest Region
| Metro Area | National Rank | Regional Rank | April Unemployment | Increase between February to April |
|---|---|---|---|---|
| Kokomo, IN | 3 | 1 | 34.1% | 30.3% |
| Sturgis, MI | 6 | 2 | 30.3% | 27.1% |
| Cadillac, MI | 6 | 3 | 30.3% | 25.5% |
| Flint, MI | 8 | 4 | 30.1% | 26.0% |
| Bellefontaine, OH | 8 | 5 | 30.1% | 25.9% |
| Elkhart-Goshen, IN | 11 | 6 | 29.3% | 26.6% |
| Muskegon, MI | 11 | 7 | 29.3% | 25.5% |
| Kendallville, IN | 13 | 8 | 28.7% | 25.7% |
| Adrian, MI | 14 | 9 | 28.2% | 24.8% |
| Hillsdale, MI | 16 | 10 | 27.7% | 24.1% |
Northeast Region
| Metro Area | National Rank | Regional Rank | April Unemployment | Increase between February to April |
|---|---|---|---|---|
| Atlantic City-Hammonton, NJ | 5 | 1 | 33.3% | 26.9% |
| Ocean City, NJ | 18 | 2 | 26.6% | 14.5% |
| St. Marys, PA | 27 | 3 | 25.4% | 18.7% |
| Berlin, NH | 51 | 4 | 22.9% | 18.3% |
| Vineyard Haven, MA | 53 | 5 | 22.7% | 15.4% |
| Laconia, NH | 58 | 6 | 22.3% | 19.0% |
| Barnstable Town, MA | 75 | 7 | 21.1% | 15.6% |
| Rutland, VT | 78 | 8 | 20.9% | 18.1% |
| East Stroudsburg, PA | 80 | 9 | 20.8% | 14.6% |
| Buffalo-Cheektowaga, NY | 114 | 10 | 19.2% | 14.3% |
Southeast Region
| Metro Area | National Rank | Regional Rank | April Unemployment | Increase between February to April |
|---|---|---|---|---|
| Sevierville, TN | 10 | 1 | 29.5% | 23.3% |
| Newport, TN | 22 | 2 | 25.6% | 19.2% |
| West Point, MS | 30 | 3 | 24.6% | 17.5% |
| Dayton, TN | 33 | 4 | 24.5% | 18.6% |
| McMinnville, TN | 37 | 5 | 24.3% | 19.7% |
| Lewisburg, TN | 40 | 6 | 24.0% | 20.1% |
| Kill Devil Hills, NC | 43 | 7 | 23.9% | 16.1% |
| Tupelo, MS | 55 | 8 | 22.5% | 18.3% |
| Gulfport-Biloxi, MS | 61 | 9 | 22.1% | 16.9% |
| Myrtle Beach-Conway, SC-NC | 71 | 10 | 21.4% | 16.9% |
Southwest Region
| Metro Area | National Rank | Regional Rank | April Unemployment | Increase between February to April |
|---|---|---|---|---|
| Rio Grande City-Roma, TX | 37 | 1 | 24.3% | 11.4% |
| Yuma, AZ | 48 | 2 | 23.1% | 11.1% |
| Eagle Pass, TX | 103 | 3 | 19.8% | 10.2% |
| Lawton, OK | 120 | 4 | 19.0% | 16.1% |
| Lake Havasu City-Kingman, AZ | 144 | 5 | 18.3% | 12.8% |
| Ardmore, OK | 144 | 6 | 18.3% | 15.0% |
| McAllen-Edinburg-Mission, TX | 148 | 7 | 18.2% | 11.5% |
| Beaumont-Port Arthur, TX | 152 | 8 | 18.1% | 12.6% |
| Deming, NM | 167 | 9 | 17.6% | 0.30% |
| Raymondville, TX | 181 | 10 | 17.4% | 9.20% |
West Region
| Metro Area | National Rank | Regional Rank | April Unemployment | Increase between February to April |
|---|---|---|---|---|
| Las Vegas-Henderson, NV | 4 | 1 | 33.5% | 29.6% |
| El Centro, CA | 15 | 2 | 28.0% | 10.9% |
| Newport, OR | 19 | 3 | 26.2% | 21.6% |
| Astoria, OR | 34 | 4 | 24.4% | 20.5% |
| Carson City, NV | 71 | 5 | 21.4% | 17.3% |
| Pahrump, NV | 73 | 6 | 21.3% | 16.4% |
| Breckenridge, CO | 75 | 7 | 21.1% | 19.5% |
| Hailey, ID | 82 | 8 | 20.7% | 17.1% |
| Edwards, CO | 88 | 9 | 20.5% | 18.4% |
| Salinas, CA | 93 | 10 | 20.2% | 10.2% |
Non-Continental States
| Metro Area | National Rank | Regional Rank | April Unemployment | Increase between February to April |
|---|---|---|---|---|
| Kahului-Wailuku-Lahaina, HI | 1 | 1 | 35.0% | 32.4% |
| Kapaa, HI | 2 | 2 | 34.4% | 31.6% |
| Hilo, HI | 40 | 3 | 24.0% | 20.7% |
| Honolulu, HI | 97 | 4 | 20.0% | 17.5% |
| Ketchikan, AK | 187 | 5 | 17.3% | 9.90% |
| Anchorage, AK | 389 | 6 | 14.3% | 9.30% |
| Fairbanks, AK | 630 | 7 | 11.2% | 6.20% |
| Juneau, AK | 661 | 8 | 10.8% | 6.80% |
Conclusions
Every metro area in the U.S. has experienced an increase in unemployment during the initial two months of the COVID-19 pandemic. Some metro areas have fared better than their respective states, but many are well above state level unemployment rates. The question remains will metro areas begin to rebound as more states and cities begin to open-up their economy, or will unemployment increases be an on-going trend? Site Selection Group will continue to monitor the latest unemployment rates by metro areas as well as by states to identify any changes or trends to help you make more informed location decisions.
