

by Allison Boden, on Apr 20, 2022 8:46:59 AM
Those associated with the industrial real estate industry will attest that the current market is more active than most can remember. This hyperactivity continues to have a material impact on location decisions within the distribution sector, which has been increasing warehousing capacity across the United States at a record pace. Site Selection Group, a full-service location advisory, economic incentives, and real estate services firm, monitors critical industrial site selection data metrics to help our clients make informed location decisions. While many of our distribution clients are aware of the hyper-active market, they are often still surprised when faced with the constrained availability of real estate and associated costs.
Vacancy rates are at an all-time low
As a result of the industrial market being so active over the past couple of years, vacancy rates are at an all-time low of 4.1% in Q2 of 2022 and falling as real estate developers struggle to build buildings fast enough to keep up with demand. However, vacancy rates are projected to bottom out this year as a gradual slowing in leasing approaches in the industrial market. The chart below shows how vacancy rates have declined over the past five years across multiple sectors. As you can see, the curve starts to flatten in early 2022 signaling that vacancy rates are projected to bottom out in late 2022 to early 2023, before increasing again in 2024-2025.
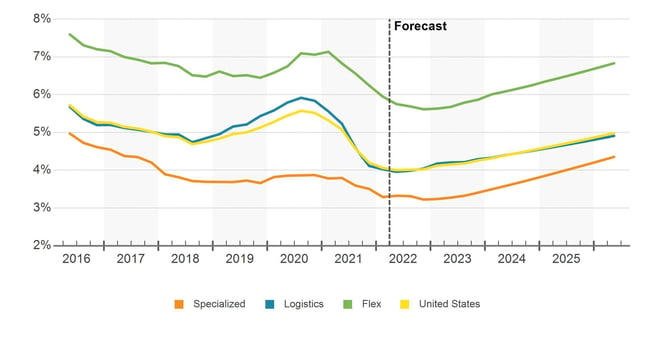
Source: Costar
Rent growth is projected to decelerate
Since the start of the pandemic in 2020, U.S. industrial rents have been accelerating. Recently, this growth was further accelerated by a lack of supply in the industrial market to meet demand. As of Q2 2022, annual industrial rent growth is running at 10.6%, with even higher year-over-year rent growth in the distribution and logistics sector specifically (11.9%). While rent growth has peaked, rent growth is not projected to lower to pre-pandemic levels until late 2023. The graph below shows the historical YOY rent increases in the industrial market and the forecasted projections for the next few years.
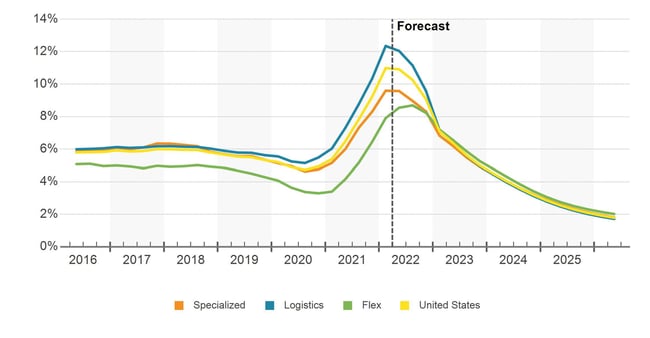
Source: Costar
Construction is unable to keep up with the demand
As discussed throughout this article, the supply of available industrial real estate has been unable to keep up with the amount of activity currently seen in the market. To illustrate this phenomenon, we show 12 major metros and the supply of buildings of 250,000 square feet and greater, both existing buildings and those currently under construction. Across each of these markets, the number of buildings that are under construction is greater than the current supply of existing buildings, and by a wide margin in some instances.
| Market | State | Existing | Under Construction |
| Salt Lake City | UT | 2 | 9 |
| Dallas-Fort Worth-Arlington | TX | 30 | 80 |
| Chicago | WI-IL | 17 | 25 |
| Charlotte | NC-SC | 5 | 11 |
| Allentown-Reading-Lehigh Valley (Northeast PA) | PA | 4 | 8 |
| Atlanta | GA | 12 | 36 |
| Cincinnati | OH-KY | 3 | 4 |
| Indianapolis | IN | 11 | 26 |
| Inland Empire | CA | 2 | 17 |
| Kansas City | MO-KS | 12 | 9 |
| Las Vegas | NV | 0 | 2 |
| Phoenix | AZ | 5 | 32 |
