

by Chris Schwinden, on Nov 17, 2025 7:15:00 AM
Across the country, electric rates have increased significantly over the past several years. The increase is due to several factors, including rising fuel costs, utility investments in distribution infrastructure, and increased demand from data centers, to name a few. However, not all regions of the United States have seen the same increases in rates. Further, while many states have generally similar industrial rates, there are some significant outliers with very high rates. These states may be significantly less favorable for companies looking to make long-term investments in new advanced manufacturing facilities.
As a result, Site Selection Group, a location advisory firm, reviewed current and historical changes in industrial electric rates by state over the past decade. We use average state-level industrial rates from the U.S. Energy Information Administration from 2015 to 2025 to calculate the percentage change in rates over the past decade. All information is reported in nominal prices. We removed data for Alaska and Hawaii, as they tend to be significant outliers, in addition to data for the District of Columbia.
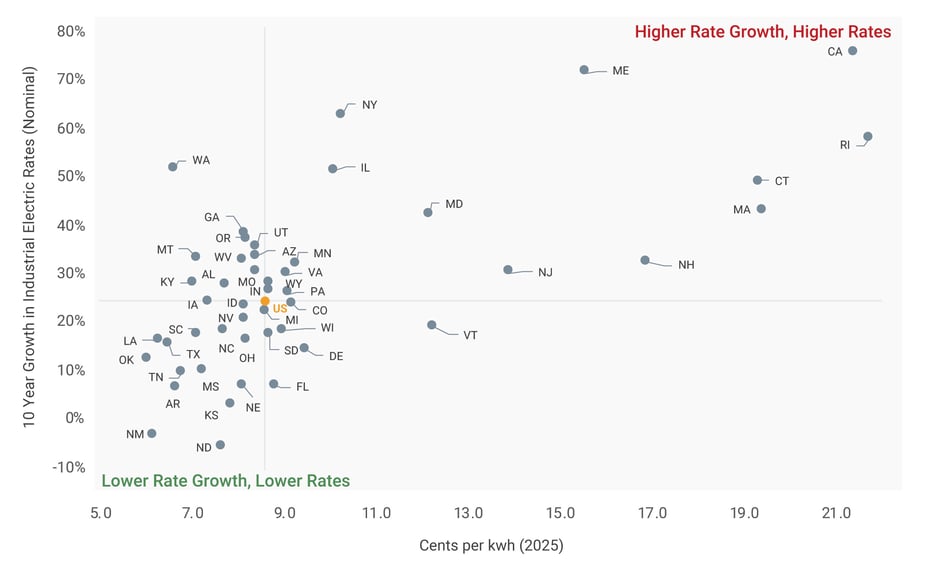
The scatterplot below shows state-level data with the current 2025 average industrial rates on the x-axis and 10-year percentage growth on the y-axis. We’ve set the axes to the average electric rate and growth rate equal to the U.S. average, so it’s easier to see which states are above or below the national average. From this graphic, we can see which states have experienced higher rate increases and higher current rates compared to states that have had much lower rate increases and lower current rates.
Generally Similar Rates and a Mix of Rate Growth for Most States
It’s easy to see a lot of clustering of states with similar rates and generally similar growth right around the U.S. average (in orange). From a current rate view in 2025, the vast majority of states tend to have industrial electric rates in the 6- to 9-cent rate, with some states like New Mexico, Oklahoma, Louisiana, Texas, and Arkansas on the lower end of that range. Growth has varied a bit more with some very rural states like North Dakota, with its significant use of wind energy and a resulting low rate of growth over the past decade. Meanwhile, states like Washington still have favorable rates thanks to an abundance of hydro power, but they have seen rates increase more over the past decade.
California, Illinois, and the Northeast Show High Rates and High Rate Growth
On the other hand, there are a number of states that are frankly outliers with very high rates and very high growth. California leads this group in the far upper right portion of the graphic with some of the highest electric rates in the country. Those rates have skyrocketed over the past decade. California is joined by most states in the Northeast, which consistently have high industrial electricity rates and significant rate growth. The only exceptions in that region are Pennsylvania and Delaware, which look much more like the rest of the country. Finally, Illinois stands out as an outlier in the Midwest, with much higher rates and rate growth.
Key Considerations for Locational Active Industrial Operations
This summary does not come as a big surprise, as Site Selection Group’s experience has shown that states with higher current rates and higher historic growth tend to be less favorable for manufacturing site selection decisions. But while this information is useful, there are a few important considerations for manufacturing companies looking to optimize their electric costs:
• EIA Data, While Helpful, Doesn’t Tell the Whole Story
Site Selection Group frequently uses EIA data in our work, but it has some weaknesses. For example, even state-level data like that presented here can move around from a year-to-year basis that doesn’t ultimately reflect realities. For example, for whatever reason, average industrial rate data for states like Pennsylvania and Nevada have fluctuated quite a bit in recent years, which is typically a sign of data challenges, not underlying changes in those states.
• Specific Utility’s Rates Can Vary Significantly
State-level data is useful, but it doesn’t capture more detailed rates from different utilities. For example, investor-owned utility rates can vary considerably from cooperative rates in many states. It’s critical in the site selection process to understand differences in rate structure between different providers, which can sometimes vary from one side of a street to the other.
• State-Level Policies Can Also Vary A Lot
Electric rate regulation is not uniform. In some states, like Texas, customers can shop for rates. In others, utilities set the rates. Some states use a hybrid of both. It’s important for companies working through the site selection process to understand these differences in order to make effective, long-term decisions.
• Good Rates Require Good Data
Finally, and most importantly, getting an accurate rate quote from an electric provider is driven by having good, accurate data on the front end. Specifically, this means having a good estimate of peak and average load, consumption, planned hours of operation, and—especially for larger projects—an accurate and realistic ramp-up schedule. The vast majority of electric providers Site Selection Group works with want to do everything they can to help a prospective company land in their service territory. But to do that effectively, electric utilities need that information so they can accurately estimate a rate, especially when that rate can include infrastructure investment and potentially, economic development riders (discounts). We’ve seen too many times when a company moves too quickly in the site selection process and risks making a costly decision on rate data that isn’t tailored to their ultimate requirement.
