

by Matt Kahn, on Oct 12, 2026, 10:00:00 AM
Economic incentive opportunities are often missed because the teams making real estate, tax, finance, and operating decisions do not always have a clear view of what peer companies are securing in the market. This monthly report is intended to give corporate decision makers a practical benchmark for evaluating whether active or planned projects may be under-leveraging available state and local incentive programs.
The report focuses on state and local economic incentives, where program design can vary significantly by jurisdiction. Counties, municipalities, and state agencies may offer tax abatements, tax credits, sales tax rebates, cash grants, real estate grants, utility rebates, infrastructure grants, or workforce training support. Because the structure, timing, and compliance requirements differ by market, comparing actual awarded deals is one of the most useful ways to calibrate expectations before a site decision is finalized.
Although federal incentives can be relevant for certain industries, particularly defense, energy, agriculture, infrastructure, and advanced manufacturing, they are not comprehensively tracked in this report. The data below covers closed state and local economic incentive activity from August 2026, sourced from IncentivesFlow, a service from FDI Intelligence. The report is designed as a benchmarking tool for CFOs, tax departments, business unit leaders, and corporate real estate teams evaluating facility expansions, relocations, or major capital investments.
Market Snapshot
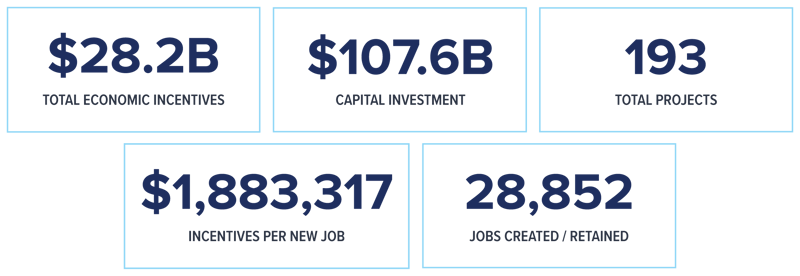
These summary figures provide a high-level benchmark for evaluating active projects. The August dataset reflects approximately $28.2 billion in total economic incentives, $107.6 billion in reported capital investment, and 28,852 jobs created or retained across 193 projects. It is important to note that a single deal — SpaceX's $27.5 billion Starbase Louisiana incentive package — accounts for the vast majority of both the incentive and capex totals this month, and drives the incentives-per-new-job figure to $1,883,317. Excluding SpaceX, the remaining 192 projects reflect $663.8 million in incentives, $7.6 billion in capital investment, and an incentives-per-new-job figure of $34,484 — consistent with the ranges seen in prior months. The headline figures should be evaluated with that context in mind.
What the Data Is Telling Finance and Real Estate Teams
August’s dataset is dominated by one of the largest economic incentive commitments ever publicly disclosed: SpaceX’s estimated $27.5 billion package from Louisiana state and local governments for Starbase Louisiana, a planned $100 billion rocket launch complex spanning approximately 125,000 acres in Vermilion Parish. The package includes an estimated $23.8 billion property tax exemption over 25 years structured as a payment in lieu of taxes, along with additional state-level grants and credits. The deal is an outlier by any historical standard and should be treated as a separate data point from the remainder of the August activity rather than a signal about what typical companies can expect from state and local incentive programs.
Outside of SpaceX, the most notable deal in August is ePropelled’s $60 million award through the U.S. Department of War’s Industrial Base Analysis and Sustainment program for an electric propulsion manufacturing expansion in Laconia, New Hampshire. While this is a federal incentive rather than a state or local one, it is included in the dataset and highlights the continued flow of defense-linked manufacturing investment into the aerospace and propulsion sector. Princeton NuEnergy’s $50 million Department of Energy grant for a lithium-ion battery recycling facility in Commerce, Georgia, is a similar federal-backed deal that signals growing investment in domestic battery materials infrastructure.
Nevada stood out as a state incentive market in August, with four deals supported by the Nevada Governor’s Office of Economic Development: Hyve Solutions in Reno ($3.7 million for AI server manufacturing), Colovore in Storey County ($4.1 million for an AI data center), and Nimble Precision in Clark County ($4.7 million for circuit board manufacturing). The cluster reflects Nevada’s active use of GOED tax abatements to attract technology infrastructure investment, particularly in AI hardware and data center development. For companies evaluating Nevada locations, the consistency of GOED support across multiple project types and sizes is a meaningful data point.
North Carolina logged two notable manufacturing incentive deals: ProVia’s $3.28 million JDIG grant for a new $120 million window manufacturing facility in Mocksville, and Steris Corporation’s $3.21 million JDIG award for a $600 million infection prevention manufacturing and distribution center in Sanford. Both deals illustrate the state’s continued use of its Job Development Investment Grant program to attract capital-intensive manufacturing investment, with the Steris project in particular offering a striking example of a large capex commitment receiving a modest incentive relative to project scale — roughly 0.5% of capex.
August activity reinforces a consistent theme from recent months: the most competitive incentive packages are typically tied to a combination of strategic industry alignment, meaningful job creation, above-average wage commitments, and capital investment that generates a clear fiscal return for the jurisdiction. Companies that approach incentive negotiations with multiple credible alternatives and a defined project timeline continue to secure the most favorable outcomes.
Selected State and Local Economic Incentive Deals
The following deals represent selected high-value state and local economic incentive packages announced in August 2026. Incentive structures may include tax abatements, tax credits, sales tax rebates, cash grants, real estate grants, utility rebates, infrastructure support, and workforce programs, depending on the jurisdiction and project profile. The table is intended to serve as a practical benchmark when evaluating whether an incentive offer on an active or planned project is directionally competitive. Unless otherwise noted, incentive amounts are performance-based and contingent on the company meeting capital investment, job creation, wage, or other compliance requirements.
Company |
Location |
Econ. Incentives |
Capex |
Jobs |
Industry Sector |
| Space Exploration Technologies | Pecan Island, LA | $27,500.0M | $100,000.0M | 3,000 | Aerospace and Defense |
| ePropelled | Laconia, NH | $60.0M | $140.7M | 212 | Aerospace and Defense |
| Princeton NuEnergy | Commerce, GA | $50.0M | $110.0M | 70 | Advanced Manufacturing |
| Allison-Smith | Oxford, AL | $15.8M | $101.0M | 403 | Advanced Manufacturing |
| RayzeBio | Whitestown, IN | $13.9M | $173.0M | 50 | Life Sciences |
| Gambino Film Production | Louisville, KY | $6.4M | $18.2M | 210 | Film & Media |
| Nimble Precision | Henderson, NV | $4.7M | $46.0M | 65 | Advanced Manufacturing |
| Bertagni 1882 | St. Charles, MO | $4.5M | $36.4M | 150 | Food and Agriculture |
| Beehive Industries | Centennial, CO | $4.2M | $100.0M | 220 | Aerospace and Defense |
| Brunk Industries | Freeport, PA | $4.2M | $31.7M | 75 | Mining and Materials |
| Colovore | Storey County, NV | $4.1M | $30.0M | 10 | Technology |
| Hyve Solutions | Reno, NV | $3.7M | $31.4M | 974 | Advanced Manufacturing |
| ProVia | Mocksville, NC | $3.3M | $120.0M | 400 | Mining and Materials |
| Steris Corporation | Sanford, NC | $3.2M | $600.0M | 335 | Life Sciences |
| WithCoverage | New York, NY | $3.0M | $25.0M | 205 | Business Services |
| Capital Group | New York, NY | $3.0M | $38.0M | 200 | Financial Services |
| Icestone Productions | Lexington, KY | $2.7M | $8.8M | 102 | Film & Media |
| Archer Daniels Midland | Clinton, IA | $2.2M | $55.5M | 53 | Food and Agriculture |
| O-I Glass | Muskogee, OK | $2.0M | $47.0M | 216 | Mining and Materials |
| Queen One | Hartford, CT | $2.0M | $11.7M | 56 | Technology |
| Tech Tag & Label | Hatfield, PA | $2.0M | $4.5M | 30 | Business Services |
| Hawthorn Aero | Miamisburg, OH | $2.0M | $16.5M | 279 | Aerospace and Defense |
How to Apply This Data Inside Your Organization
For tax departments: the economic incentive packages reflected in this dataset may have very different tax, accounting, and compliance implications depending on structure. A property tax abatement, refundable or nonrefundable tax credit, cash grant, infrastructure reimbursement, or utility rebate will affect timing, recognition, documentation, and clawback exposure differently. Before comparing an outside benchmark to an internal project, confirm the instrument, benefit period, required filings, and performance obligations.
For CFOs and business unit leaders: if a major project is under consideration — whether it involves a new facility, expansion, consolidation, relocation, or workforce growth — incentive analysis should begin before the location decision is finalized. Many of the deals in this report were negotiated while companies still had credible location alternatives. Once a lease is signed, construction starts, or the project is publicly announced, negotiating leverage with state and local economic development organizations can decline quickly.
For corporate real estate executives: incentives should be integrated into the site selection timeline rather than treated as a late-stage add-on. Site Selection Group works exclusively on behalf of occupiers, with no landlord or developer relationships, so the incentive strategy is aligned with the company’s financial and operational objectives. Early coordination between real estate, tax, finance, and operations can materially improve the value and usability of an incentive package.
Source: IncentivesFlow, a Service from FDI Intelligence. Data covers state and local economic incentive deals tracked through August 2026. Federal economic incentives are not comprehensively included.
© 2026 Site Selection Group, LLC. All rights reserved. This report is for informational purposes only and does not constitute legal, tax, or investment advice.
