

by Matt Kahn, on Jul 10, 2026, 9:44:59 AM
Economic incentive opportunities are often missed because the teams making real estate, tax, finance, and operating decisions do not always have a clear view of what peer companies are securing in the market. This monthly report is intended to provide corporate decision-makers with a practical benchmark for evaluating whether active or planned projects may be underleveraging available state and local incentive programs.
The report focuses on state and local economic incentives, where program design can vary significantly by jurisdiction. Counties, municipalities, and state agencies may offer tax abatements, tax credits, sales tax rebates, cash grants, real estate grants, utility rebates, infrastructure grants, or workforce training support. Because the structure, timing, and compliance requirements differ by market, comparing actual awarded deals is one of the most useful ways to calibrate expectations before a site decision is finalized.
Although federal incentives can be relevant for certain industries, particularly defense, energy, agriculture, infrastructure, and advanced manufacturing, they are not comprehensively tracked in this report. The data below covers closed state and local economic incentive activity from May 2026, sourced from IncentivesFlow, a service from FDI Intelligence. The report is designed as a benchmarking tool for CFOs, tax departments, business unit leaders, and corporate real estate teams evaluating facility expansions, relocations, or major capital investments.
Market Snapshot
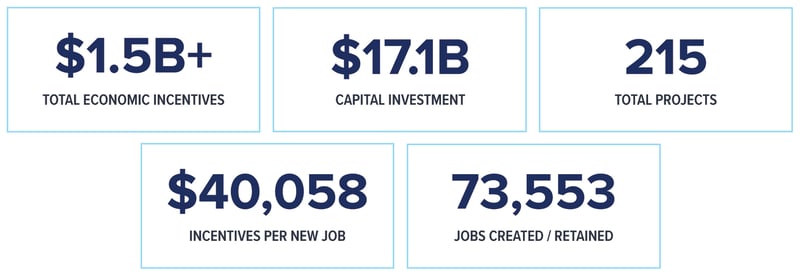
These summary figures provide a high-level benchmark for evaluating active projects. The May dataset reflects more than $1.5 billion in total economic incentives, $17.1 billion in reported capital investment, and 73,553 jobs created or retained across 215 projects. The $40,058 incentive value per new job and 10.8% capex recovery rate are useful reference points, but they should be evaluated alongside project-specific factors such as job quality, industry, location, wage levels, capital intensity, and timing.
What the Data Is Telling Finance and Real Estate Teams
May activity was shaped by several unusually large capital investment projects. Saronic's $3.2 billion autonomous shipbuilding project in Brownsville, Texas, and USA Rare Earth's $1.4 billion critical minerals project in Sierra Blanca, Texas, helped push total reported capital investment well above the prior-month sample. However, the data also shows that large capex alone does not guarantee the highest incentive yield; the most competitive packages are typically tied to a combination of capital investment, job creation, strategic industry alignment, and local economic impact.
Texas accounted for a significant share of the largest May incentive packages. Five of the top ten deals were located in Texas, spanning autonomous maritime defense manufacturing, electronics production, gypsum and building materials, grocery supply chain operations, and rare earth processing. That concentration reinforces how aggressively Texas continues to compete for large-scale industrial, defense, technology, and supply chain investments through a mix of state and local incentive tools.
The top deals also show how varied incentive activity can be by sector. Aerospace and defense, advanced manufacturing, critical minerals, building materials, retail distribution, consumer products, and technology infrastructure all appear in the May list. For finance and real estate teams, that mix matters: the relevant incentive strategy for a capital-intensive rare earth project will look very different from a headquarters relocation, food distribution expansion, or manufacturing retention project.
The May data reinforces the importance of benchmarking before a location decision is announced. A headline incentive number may be driven by a large job commitment, a retention component, a strategic industry designation, or a jurisdiction-specific program rather than simply by total project cost. Companies that wait until a preferred site is selected often lose negotiating leverage and may not be able to access the full range of state, county, municipal, utility, and workforce incentive options available earlier in the process.
Selected State and Local Economic Incentive Deals
The following deals represent selected high-value state and local economic incentive packages announced in May 2026. Incentive structures may include tax abatements, tax credits, sales tax rebates, cash grants, real estate grants, utility rebates, infrastructure support, and workforce programs, depending on the jurisdiction and project profile. The table is intended to serve as a practical benchmark when evaluating whether an incentive offer on an active or planned project is directionally competitive. Unless otherwise noted, incentive amounts are performance-based and contingent on the company meeting capital investment, job creation, wage, or other compliance requirements.
Company |
Location |
Economic Incentives |
Capex |
Jobs |
Industry Sector |
| Saronic | Brownsville, TX | $228.9M | $3,200.0M | 10,001 | Aerospace and Defense |
| Celestica | Fort Worth, TX | $41.7M | $876.0M | 1,700 | Advanced Manufacturing |
| Knauf Gips | Orange, TX | $30.9M | $1,175.0M | 200 | Food and Agriculture |
| Penn Aluminum International | Murphysboro, IL | $18.8M | $0 | 293 | Mining and Materials |
| American Tungsten & Antimony | Antimony, UT | $16.5M | $287.4M | 400 | Mining and Materials |
| Howard Edward Butt | San Antonio, TX | $15.0M | $700.0M | 1,232 | Retail and Hospitality |
| USA Rare Earth | Sierra Blanca, TX | $14.2M | $1,400.0M | 260 | Aerospace and Defense |
| Altria | Hopkinsville, KY | $12.0M | $251.0M | 200 | Food and Agriculture |
| Unilever | New Haven, CT | $10.0M | $270.0M | 727 | Food and Agriculture |
| Redapt | Henderson, NV | $10.0M | $3.8M | 100 | Technology Infrastructure |
| Electricite de France | Richland, WA | $8.8M | $65.2M | 78 | Energy and Utilities |
| Cemex | Tampa, FL | $7.0M | $29.0M | 36 | Mining and Materials |
| Newstead Ranch | Newstead, NY | $6.7M | $32.0M | 0 | Retail and Hospitality |
| Bridgestone | Williamsburg, KY | $6.5M | $92.8M | 250 | Advanced Manufacturing |
| Clarios | St Joseph, MO | $5.6M | $390.0M | 1,059 | Food and Agriculture |
| Combe | Rantoul, IL | $5.0M | $30.0M | 120 | Advanced Manufacturing |
| Coulter Ventures | Columbus, OH | $5.0M | $38.0M | 714 | Financial Services |
| Slate Auto | Troy, MI | $5.0M | $10.4M | 392 | Advanced Manufacturing |
| Quanta Services | Centralia, IL | $4.1M | $15.3M | 201 | Transportation and Logistics |
| Process Equipment & Service Co. | Farmington, NM | $3.9M | $0 | 80 | Advanced Manufacturing |
| BorgWarner | Hendersonville, NC | $3.7M | $100.0M | 378 | Advanced Manufacturing |
| Corteva Agriscience | Holland, PA | $3.5M | $7.0M | 130 | Food and Agriculture |
| IonQ | Boulder, CO | $2.8M | $40.0M | 150 | Advanced Manufacturing |
| Barilla | Avon, NY | $2.8M | $170.0M | 90 | Food and Agriculture |
| MAH02 Ent | Owensboro, KY | $2.7M | $7.8M | 76 | Entertainment |
| Morla Capital Finance | Morgantown, WV | $2.3M | $0 | 70 | Financial Services |
| Atlas Holdings | Potsdam, NY | $2.0M | $0 | 70 | Financial Services |
| Hartzell Propeller | Piqua, OH | $2.0M | $17.3M | 443 | Aerospace and Defense |
| Averitt Express | Louisville, KY | $2.0M | $113.1M | 246 | Transportation and Logistics |
| Premier Automation | Murrysville, PA | $2.0M | $4.1M | 241 | Advanced Manufacturing |
| Upstate Niagara Cooperative | North Lawrence, NY | $2.0M | $5.0M | 128 | Food and Agriculture |
| McCarl's | Aliquippa, PA | $2.0M | $15.0M | 130 | Food and Agriculture |
| Candlelight Cabinetry | Lockport, NY | $2.0M | $11.0M | 100 | Advanced Manufacturing |
How to Apply This Data Inside Your Organization
For tax departments: the economic incentive packages reflected in this dataset may have very different tax, accounting, and compliance implications depending on structure. A property tax abatement, refundable or nonrefundable tax credit, cash grant, infrastructure reimbursement, or utility rebate will affect timing, recognition, documentation, and clawback exposure differently. Before comparing an outside benchmark to an internal project, confirm the instrument, benefit period, required filings, and performance obligations.
For CFOs and business unit leaders: if a major project is under consideration - whether it involves a new facility, expansion, consolidation, relocation, or workforce growth - incentive analysis should begin before the location decision is finalized. Many of the deals in this report were negotiated while companies still had credible location alternatives. Once a lease is signed, construction starts, or the project is publicly announced, negotiating leverage with state and local economic development organizations can decline quickly.
For corporate real estate executives: incentives should be integrated into the site selection timeline rather than treated as a late-stage add-on. Site Selection Group works exclusively on behalf of occupiers, with no landlord or developer relationships, so the incentive strategy is aligned with the company's financial and operational objectives. Early coordination between real estate, tax, finance, and operations can materially improve the value and usability of an incentive package.
Source: IncentivesFlow, a Service from FDI Intelligence. Data covers state and local economic incentive deals tracked through May 2026. Federal economic incentives are not comprehensively included.
This report is for informational purposes only and does not constitute legal, tax, or investment advice.
