

by Matt Kahn, on Aug 17, 2026, 9:29:59 AM
Economic incentive opportunities are often missed because the teams making real estate, tax, finance, and operating decisions do not always have a clear view of what peer companies are securing in the market. This monthly report is intended to give corporate decision makers a practical benchmark for evaluating whether active or planned projects may be under-leveraging available state and local incentive programs.
The report focuses on state and local economic incentives, where program design can vary significantly by jurisdiction. Counties, municipalities, and state agencies may offer tax abatements, tax credits, sales tax rebates, cash grants, real estate grants, utility rebates, infrastructure grants, or workforce training support. Because the structure, timing, and compliance requirements differ by market, comparing actual awarded deals is one of the most useful ways to calibrate expectations before a site decision is finalized.
Although federal incentives can be relevant for certain industries, particularly defense, energy, agriculture, infrastructure, and advanced manufacturing, they are not comprehensively tracked in this report. The data below covers closed state and local economic incentive activity from June 2026, sourced from IncentivesFlow, a service from FDI Intelligence. The report is designed as a benchmarking tool for CFOs, tax departments, business unit leaders, and corporate real estate teams evaluating facility expansions, relocations, or major capital investments.
Market Snapshot
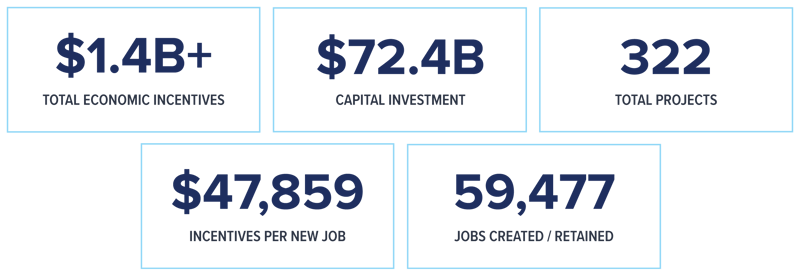
These summary figures provide a high-level benchmark for evaluating active projects. The June dataset reflects approximately $1.4 billion in total economic incentives, $72.4 billion in reported capital investment, and 59,477 jobs created or retained across 322 projects. The $47,859 incentive value per new job and 9.9% capex recovery rate are useful reference points, but they should be evaluated alongside project-specific factors such as job quality, industry, location, wage levels, capital intensity, and timing.
What the Data Is Telling Finance and Real Estate Teams
June’s dataset was shaped by a cluster of large capital investment projects in semiconductor manufacturing and advanced materials. Coherent Corp’s $2.409 billion InP semiconductor expansion in Sherman, Texas, anchored the month’s capital investment total alongside WH Group’s $1.3 billion Smithfield Foods facility in South Dakota and VulcanForms’ $1.3 billion advanced manufacturing expansion in Massachusetts. The concentration of billion-dollar-plus deals reflects continued momentum in domestic semiconductor capacity and food manufacturing supply chain investment.
California emerged as a notable incentive market in June, with multiple deals supported by the California Competes Tax Credit program across solar manufacturing, space manufacturing, and semiconductor materials production. The state’s willingness to deploy competitive credit packages for advanced manufacturing is meaningful context for companies evaluating California as a location despite its high-cost reputation. For finance and real estate teams, it reinforces that California’s incentive toolkit is more active than it is often credited.
The June data includes a second USA Rare Earth deal — following the May Round Top Mountain expansion in Texas — with a new $1.2 billion magnet manufacturing facility in Blacksburg, South Carolina. The back-to-back announcements signal an accelerating buildout of domestic rare earth and critical minerals production infrastructure. For companies in defense, clean energy, semiconductors, or advanced manufacturing that rely on rare earth inputs, the speed of this investment is relevant context for supply chain planning.
The Portman Holdings hotel deal in Cincinnati is the largest single incentive package in June at $249 million, and it illustrates how public-private deal structures for major urban development projects can produce headline incentive figures that look very different from standard industrial or manufacturing packages. For benchmarking purposes, hospitality and real estate development incentives — which often involve TIF bonds, city loans, and layered financing — are generally not comparable to the performance-based tax credits and grants that drive most corporate location decisions.
June activity reinforces a consistent theme from recent months: the most competitive incentive packages are typically tied to a combination of strategic industry alignment, meaningful job creation, above-average wage commitments, and capital investment that generates a clear fiscal return for the jurisdiction. Companies that approach incentive negotiations with multiple credible alternatives and a defined project timeline continue to secure the most favorable outcomes.
Selected State and Local Economic Incentive Deals
The following deals represent selected high-value state and local economic incentive packages announced in June 2026. Incentive structures may include tax abatements, tax credits, sales tax rebates, cash grants, real estate grants, utility rebates, infrastructure support, and workforce programs, depending on the jurisdiction and project profile. The table is intended to serve as a practical benchmark when evaluating whether an incentive offer on an active or planned project is directionally competitive. Unless otherwise noted, incentive amounts are performance-based and contingent on the company meeting capital investment, job creation, wage, or other compliance requirements.
Company |
Location |
Econ. Incentives |
Capex |
Jobs |
Industry Sector |
| Portman Holdings | Cincinnati, OH | $249.0M | $540.0M | 1,201 | Retail and Hospitality |
| Vsun Solar | Humble, TX | $60.0M | $357.0M | 400 | Advanced Manufacturing |
| Coherent Corp | Sherman, TX | $50.0M | $2,409.0M | 1,000 | Advanced Manufacturing |
| Vast Space | Long Beach, CA | $32.8M | $87.5M | 657 | Aerospace and Defense |
| WH Group | Sioux Falls, SD | $29.9M | $1,300.0M | 4,982 | Food and Agriculture |
| Ross Stores | Bakersfield, CA | $25.0M | $494.6M | 200 | Transportation and Logistics |
| Graphene & Solar Technologies | Calipatria, CA | $22.5M | $339.5M | 447 | Advanced Manufacturing |
| VulcanForms | Devens, MA | $21.3M | $1,300.0M | 1,063 | Advanced Manufacturing |
| General Atomics | Poway, CA | $20.0M | $38.0M | 10 | Aerospace and Defense |
| Morgan Stanley | Dallas, TX | $18.5M | $684.0M | 2,300 | Financial Services |
| Nokia | Allentown, PA | $13.3M | $30.0M | 558 | Advanced Manufacturing |
| Shearers Foods | Moraine, OH | $12.5M | $110.0M | 600 | Food and Agriculture |
| Aviation Exteriors Louisiana | New Iberia, LA | $11.0M | $74.0M | 432 | Aerospace and Defense |
| USA Rare Earth | Blacksburg, SC | $7.5M | $1,200.0M | 490 | Mining and Materials |
| Vulcaflex | Auburn, AL | $7.3M | $70.0M | 130 | Advanced Manufacturing |
| Rogo | New York, NY | $6.5M | $14.0M | 400 | Financial Services |
| Raytheon Technologies | Portsmouth, RI | $6.2M | $100.0M | 150 | Aerospace and Defense |
| Rural King | Vandalia, IL | $4.7M | $18.8M | 30 | Transportation and Logistics |
| Schunk | Georgetown, TX | $3.9M | $42.0M | 25 | Advanced Manufacturing |
| Kajima (Core5) | Cincinnati, OH | $3.8M | $33.0M | 50 | Retail and Hospitality |
| AeroVironment | Xenia, OH | $3.5M | $7.5M | 100 | Aerospace and Defense |
| Ultra Clean Technology | Austin, TX | $3.1M | $43.0M | 287 | Advanced Manufacturing |
| Kimball Midwest | Columbus, OH | $2.8M | $7.1M | 717 | Transportation and Logistics |
| Caribbean Food Delights | Tappan, NY | $2.8M | $17.0M | 175 | Food and Agriculture |
| Belmark | De Pere, WI | $2.5M | $121.0M | 143 | Advanced Manufacturing |
| Jabil Circuit | East Flat Rock, NC | $2.0M | $102.0M | 148 | Advanced Manufacturing |
| Cement Roadstone Holdings | Cedar Park, TX | $2.0M | $31.3M | 169 | Mining and Materials |
How to Apply This Data Inside Your Organization
For tax departments: the economic incentive packages reflected in this dataset may have very different tax, accounting, and compliance implications depending on structure. A property tax abatement, refundable or nonrefundable tax credit, cash grant, infrastructure reimbursement, or utility rebate will affect timing, recognition, documentation, and clawback exposure differently. Before comparing an outside benchmark to an internal project, confirm the instrument, benefit period, required filings, and performance obligations.
For CFOs and business unit leaders: if a major project is under consideration — whether it involves a new facility, expansion, consolidation, relocation, or workforce growth — incentive analysis should begin before the location decision is finalized. Many of the deals in this report were negotiated while companies still had credible location alternatives. Once a lease is signed, construction starts, or the project is publicly announced, negotiating leverage with state and local economic development organizations can decline quickly.
For corporate real estate executives: incentives should be integrated into the site selection timeline rather than treated as a late-stage add-on. Site Selection Group works exclusively on behalf of occupiers, with no landlord or developer relationships, so the incentive strategy is aligned with the company’s financial and operational objectives. Early coordination between real estate, tax, finance, and operations can materially improve the value and usability of an incentive package.
Source: IncentivesFlow, a Service from FDI Intelligence. Data covers state and local economic incentive deals tracked through June 2026. Federal economic incentives are not comprehensively included.
© 2026 Site Selection Group, LLC. All rights reserved. This report is for informational purposes only and does not constitute legal, tax, or investment advice.
