by Josh Bays, on May 16, 2022 1:58:59 PM
Since it can be extremely difficult in today’s labor market to find quality labor, distribution employers need to stay ahead of ever-changing market trends to control costs in the coming years and budget accordingly. Site Selection Group, a leading location advisory, real estate, and economic incentive services firm, looked at wage escalation in the distribution center industry to understand national trends.
Distribution center activity heavily gravitates to populated markets
Due to a variety of factors including access to consumers, availability of workers, and robust transportation networks, most distribution center activity is focused on large metro areas. For this reason, SSG focused on those metros with a population over 500,000 when researching the topic of wage inflation and how it correlates to occupation concentration. There are 111 metro areas in the United States that fall into this category.
According to the Emsi, the average annual wage inflation for distribution center occupations in the United States over the past five years is 2.88%. Although this number seems low given Site Selection Group’s recent project experience, it is the best relative indicator from one metro area to another over time. Conventional thought would be that wage inflation is higher in markets that have high distribution center activity as the competition for employment is greater. To evaluate activity, Site Selection Group looked at the simplistic metric of a location quotient which compares a metro’s concentration of employment to that of the national average. A location quotient of 1 means that a metro is right at the national average for concentration.
Wage escalation does not discriminate against regions
The following table shows the 10 metro areas with the highest five-year average wage escalation. Again, please note that while these estimates seem low given recent project experience, this data is valuable to see how markets compare to one another. There is some geographic diversity among these communities, but four of the top 10 are located in California.
| Metro Area | State | Average Wage Escalation | Concentration (1= National Average) |
| Chicago-Naperville-Elgin | IL-IN-WI | 4.20% | 1.21 |
| Tucson | AZ | 4.00% | 0.81 |
| San Diego-Chula Vista-Carlsbad | CA | 3.90% | 0.74 |
| Los Angeles-Long Beach-Anaheim | CA | 3.90% | 0.94 |
| San Jose-Sunnyvale-Santa Clara | CA | 3.90% | 0.52 |
| Poughkeepsie-Newburgh-Middletown | NY | 3.80% | 0.99 |
| Oxnard-Thousand Oaks-Ventura | CA | 3.80% | 0.81 |
| Columbus | OH | 3.80% | 1.29 |
| Urban Honolulu | HI | 3.70% | 0.89 |
| New York-Newark-Jersey City | NY-NJ-PA | 3.70% | 0.91 |
Source: Emsi, Transportation and Material Moving Occupations
The following table shows the 10 metro areas with the lowest five-year average wage escalation. Again, there is large geographic diversity in the results, but SSG expects trends to continue to shift over the next few years with minimum wage increases.
| Metro Area | State | Average Wage Escalation | Concentration (1= National Average) |
| Richmond | VA | 1.20% | 1.01 |
| Kansas City | MO-KS | 1.40% | 1.07 |
| Scranton--Wilkes-Barre | PA | 1.60% | 1.63 |
| Youngstown-Warren-Boardman | OH-PA | 1.60% | 1.05 |
| Fayetteville-Springdale-Rogers | AR | 1.70% | 1.34 |
| Tulsa | OK | 1.70% | 0.93 |
| New Haven-Milford | CT | 1.70% | 0.96 |
| Charleston-North Charleston | SC | 1.80% | 0.98 |
| Stockton | CA | 1.80% | 2.2 |
| Columbia | SC | 1.80% | 1.01 |
Finding areas with talent but modest wage escalation
In the battle to hire and retain a qualified workforce, distribution center operators need to balance finding markets with trained talent and those that have manageable workforce costs. The following table shows the 10 metros with the highest location quotient that has a historical average wage escalation below the average of 2.88%. Of note, a few Pennsylvania markets are included in this list as well as a California metro (Stockton).
| Metro Area | State | Average Wage Escalation | Concentration (1= National Average) |
| Stockton | CA | 1.80% | 2.2 |
| Memphis | TN-MS-AR | 2.80% | 1.92 |
| Lakeland-Winter Haven | FL | 2.60% | 1.84 |
| Scranton--Wilkes-Barre | PA | 1.60% | 1.63 |
| Allentown-Bethlehem-Easton | PA-NJ | 2.00% | 1.6 |
| Louisville/Jefferson County | KY-IN | 2.70% | 1.55 |
| Harrisburg-Carlisle | PA | 2.00% | 1.53 |
| Indianapolis-Carmel-Anderson | IN | 2.80% | 1.4 |
| Greensboro-High Point | NC | 2.70% | 1.35 |
| Fayetteville-Springdale-Rogers | AR | 1.70% | 1.34 |
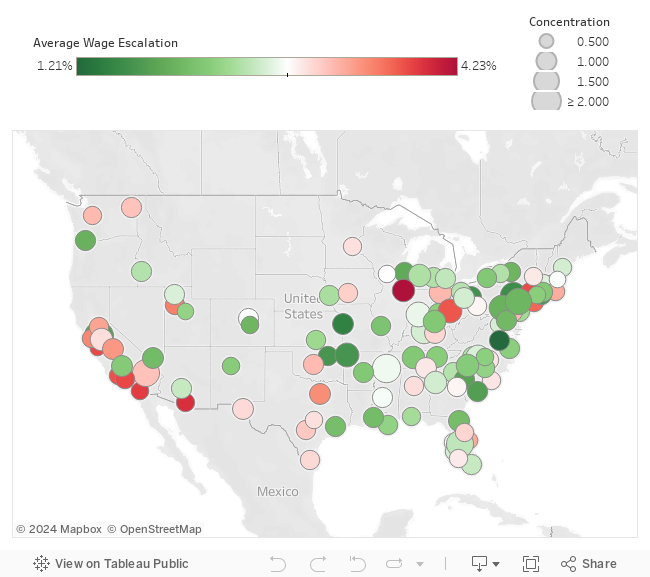
The following interactive map includes concentration and wage escalation data for all 111 metro areas with a population greater than 500,000. Hover over a point for more details.