by Josh Bays, on Oct 19, 2021 1:28:11 PM
Site Selection Group, a full-service location advisory, economic incentives, and real estate services firm, utilizes a variety of innovative tools and analyses to help its clients evaluate locations for manufacturing investment. To ensure manufacturers are choosing the best location for operational success, their site selection process should employ a top-down approach that applies a series of analyses and filters until the most competitive option(s) are identified. If executed correctly, the entire process and the critical inputs that influenced filtering will be clearly documented.
Ranking the most competitive states for manufacturing
As a demonstration of this type of inclusive approach, Site Selection Group used its proprietary GeoCision® analysis to provide a scoring of all 50 states based on weighted site selection variables that measure primary considerations for manufacturers (In real practice, this type of analysis would be done at more granular geographies). While these factors are not comprehensive, they represent those often utilized in industrial projects.
Although location criteria are unique to each specific project’s needs, there are standard site selection drivers that typically drive most manufacturing location decisions. A company’s ability to hire and retain a qualified workforce, as well as its ability to receive and ship goods in a cost-effective and timely manner, are typically the most influential factors that drive final site selection decisions.
However, the business environment, regulatory climate, utilities, infrastructure, real estate, and economic incentives play an important role in the process. Since no location scores the best in each of these categories, the optimal location for a project is one that has no critical deficiencies. Those factors and weightings used for this exercise are shown in the table below.
| Category | Weighting | Summary |
| Labor Scalability | 5.00% | Measures the volume of the workforce to ensure companies can scale their workforce |
| Target Skill Sets | 25.00% | Assesses industry and occupation presence to confirm the availability of targeted skill sets |
| Labor Demand | 20.00% | Analyzes the pressures other employers place on the employment market |
| Operating Costs | 30.00% | Quantifies the operating costs such as utilities, taxes, real estate, labor, etc. |
| Organized Labor | 10.00% | Assesses the threat posed by organized labor |
| Accessibility | 10.00% | Analyzes the population base with a one-day drive time of the site and distance to major ports |
Regions vary in competitiveness
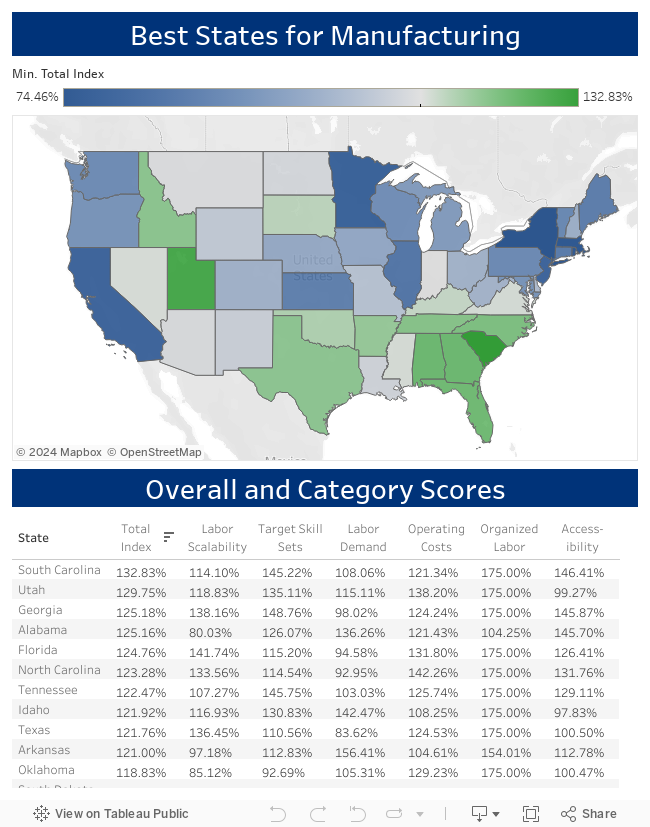
Site Selection Group mapped and listed the 2021 results in the dashboard below. A score of 100% in any one category represents the national average. While no one state or region is a perfect fit for every project or specific industrial sector, there are a couple of clear trends.
For starters, we see some of the “usual suspects” rise to the top – states that tend to rank well in manufacturing and business competitiveness rankings. Those include southeastern states such as South Carolina, Georgia, and Alabama and western states including Utah and Idaho. The inclusion of these western markets near the top of the list is a key difference between these results and those seen in previous years. In addition, many states show clear trade-offs between labor quality and cost, something companies will need to consider in their long-term strategy.