

by Josh Bays, on Mar 23, 2021 2:33:13 PM
A couple of months into the pandemic, we attempted to gauge how COVID-19 was affecting workforce demand in the distribution center and logistics industry. Now that a year has come and gone since the initial outbreak of the pandemic, Site Selection Group wanted to evaluate the same dataset for the last 12 months. It is apparent that the initial shock of COVID-19 subsided rather quickly, but not all metro areas have had the same experience. Understanding the competitive trends in markets can be an important site selection factor as companies seek to attract and retain a workforce.
Assessing labor market trends in the ‘New Normal’
The long-term prognosis for any labor market is going to be heavily influenced by the industry composition of that specific community. Although the latest cutting-edge data and analytical models can be used to peek into the crystal ball to make comparisons, many conclusions drawn today about the future are merely conjecture.
Assessing labor markets in the short term is proving to be challenging as most workforce data lags too long in this dynamic environment to accurately capture reality (e.g. unemployment data). While any workforce analysis should include a heavy dose of organic research such as interviews of existing employers, education institutions and workforce development partners, Site Selection Group leverages job posting data that can be informative in understanding competitive pressures in a market almost real time.
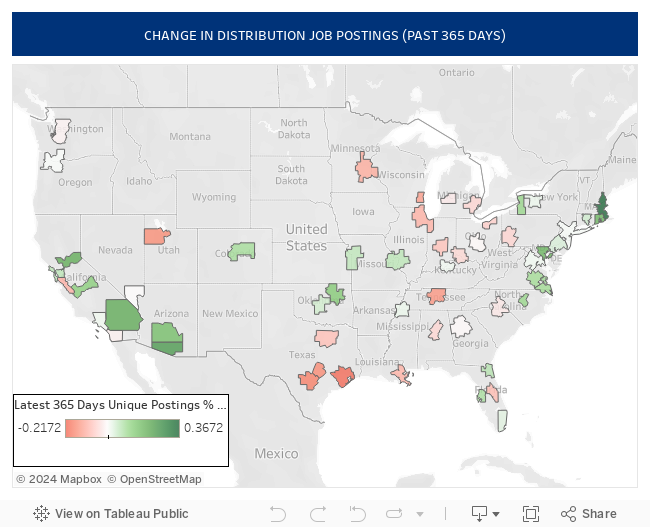
Job posting data for transportation and material moving occupations
Job posting data, one of the few almost real-time labor market data sources, is simply the volume of job openings being advertised by existing employers. This data can be categorized by time period, geography and occupation. Although there are a variety of relative measures that can be used with job posting data (i.e. posting intensity, unique postings, etc.), it is interesting to see how overall job postings have changed for distribution occupations over the last 12 months. The following map represents all metro areas with a population over 1 million shaded by percent change in unique job postings for distribution occupations over the last 365 days. In a stark contrast to the first 90 days of the pandemic, the change in job postings over the last year have been largely positive, especially in the Southwest, Central U.S. and Northeast.
The following table shows the 10 metro areas with a population greater than 1 million that had the least change in unique job postings for distribution center and logistics related occupations over the last year.
Top 10 Metro Areas with the Least Change in Job Postings in the Last Year
| Metro Area | State | % Change in Unique Postings |
| Memphis | TN-MS-AR | 1.8% |
| Rochester | NY | 1.5% |
| Los Angeles-Long Beach-Anaheim | CA | 1.3% |
| Louisville/Jefferson County | KY-IN | 1.3% |
| Washington-Arlington-Alexandria | DC-VA-MD-WV | 1.1% |
| New York-Newark-Jersey City | NY-NJ-PA | 0.6% |
| Portland-Vancouver-Hillsboro | OR-WA | 0.5% |
| Las Vegas-Henderson-Paradise | NV | -0.3% |
| Atlanta-Sandy Springs-Alpharetta | GA | -0.7% |
| Columbus | OH | -0.8% |
On the other hand, the following table shows those metro areas that saw the most drastic increase in unique job postings for distribution center and logistics occupations over the last year.
Top 10 Metro Areas with the Greatest Change in Job Postings in the Last Year
| Metro Area | State | % Change in Unique Postings |
| Boston-Cambridge-Newton | MA-NH | 36.7% |
| Tucson | AZ | 25.5% |
| Riverside-San Bernardino-Ontario | CA | 21.3% |
| Sacramento-Roseville-Folsom | CA | 21.2% |
| Providence-Warwick | RI-MA | 19.3% |
| Baltimore-Columbia-Towson | MD | 19.3% |
| Phoenix-Mesa-Chandler | AZ | 17.0% |
| Tulsa | OK | 13.9% |
| Fresno | CA | 13.0% |
| Raleigh-Cary | NC | 11.1% |
