Top 20 Metro Areas for Warehouse Construction
by Josh Bays, on Nov 23, 2015 1:49:13 PM
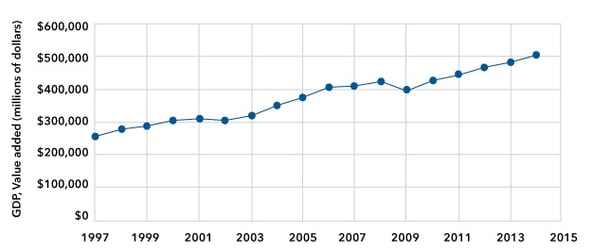
According to industry GDP statistics, the transportation and warehousing industry has grown each year since the 2008 economic downturn. From 2009 to 2014, the industry’s average annual GDP growth was 4.58%. Driven by growth in e-commerce and a demand for just-in-time products, companies in this sector are in ever more desperate need for new distribution centers in strategic markets that offer the optimal mix of labor availability, favorable business environment, logistics networks and economic incentives.
Transportation and Warehousing Industry Growth

![]()
Speed-to-market concerns
The need to satisfy customer demand in a timely fashion is increasing speed-to-market concerns for distribution center operators. When new distribution center projects are navigating the site selection process, they can shave nine to 12 months off the project schedule by choosing an existing building versus constructing a facility. Given the consistent growth in the transportation and logistics industry, warehouse construction has struggled to keep pace with the demand for real estate. The lack of available buildings is magnified in competitive markets that offer a good mix of workforce characteristics, developed transportation networks, favorable business climates, aggressive economic incentives, and access to population centers.
Top markets for warehouse construction
Site Selection Group researched the top metro areas that are trying to keep pace with the demand for facilities. The table and map below show those metro areas with the most warehouse product under construction. The Riverside-San Bernardino metro area, also known as the Inland Empire, has the most warehouse space under construction based on statistics from the third quarter of 2015. The region has more than 17.5 million square feet of warehouse real estate under construction.
The table below shows the top 20 markets for most warehouse square footage under construction.
| Market | Under Construction SF |
|---|---|
| Inland Empire | 17,583,660 |
| Philadelphia | 14,415,244 |
| Atlanta | 14,293,084 |
| Dallas-Fort Worth | 14,142,017 |
| Houston | 10,094,245 |
| Chicago | 10,031,670 |
| Reno | 6,024,000 |
| Cincinnati | 4,804,304 |
| Charleston, SC | 4,635,086 |
| Greenville-Spartanburg | 3,990,860 |
| Kansas City | 3,728,671 |
| St. Louis | 3,067,376 |
| Stockton-Modesto | 2,991,398 |
| Minneapolis | 2,766,552 |
| Washington | 2,607,722 |
| East Bay/Oakland | 2,597,860 |
| Oklahoma City | 2,437,100 |
| Phoenix | 2,423,434 |
| Los Angeles | 2,348,227 |
| Detroit | 2,111,637 |
![]()

